Fig. 1.
Download original image
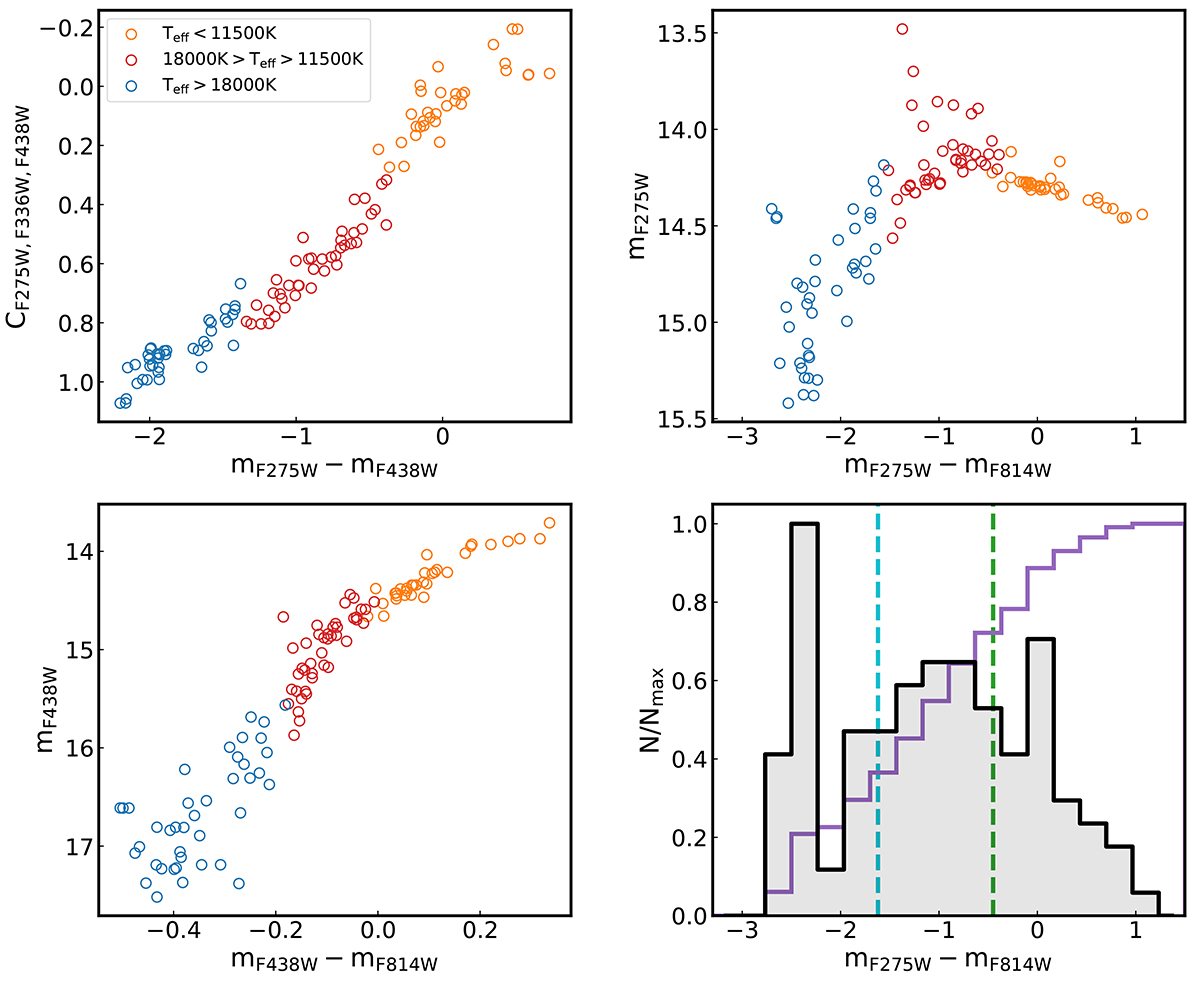
Top-left panel: CF275W, F336W, F814W vs mF275W − mF438W pseudo two-colour diagram of the HB stars in NGC 6752. Stars with T < 11 500 K, T > 18 000 K, and 11 500 K < T < 18 000 K are marked with orange, blue, and red points. Top-right panel: mF275W vs mF275W − mF814W CMD of the HB stars in NCG 6752. Bottom-right panel: Histogram of the colour distribution of the photometric data. The purple profile represents the cumulative distribution of the points. The two dashed lines, green and cyan, mark the position of the G- and M- jumps, respectively. Bottom-left panel: mF438W vs mF438W − mF814W CMD of the HB stars in NCG 6752. Where applicable, we plotted the stars in the three ranges of temperature with the same colour coding.
Current usage metrics show cumulative count of Article Views (full-text article views including HTML views, PDF and ePub downloads, according to the available data) and Abstracts Views on Vision4Press platform.
Data correspond to usage on the plateform after 2015. The current usage metrics is available 48-96 hours after online publication and is updated daily on week days.
Initial download of the metrics may take a while.