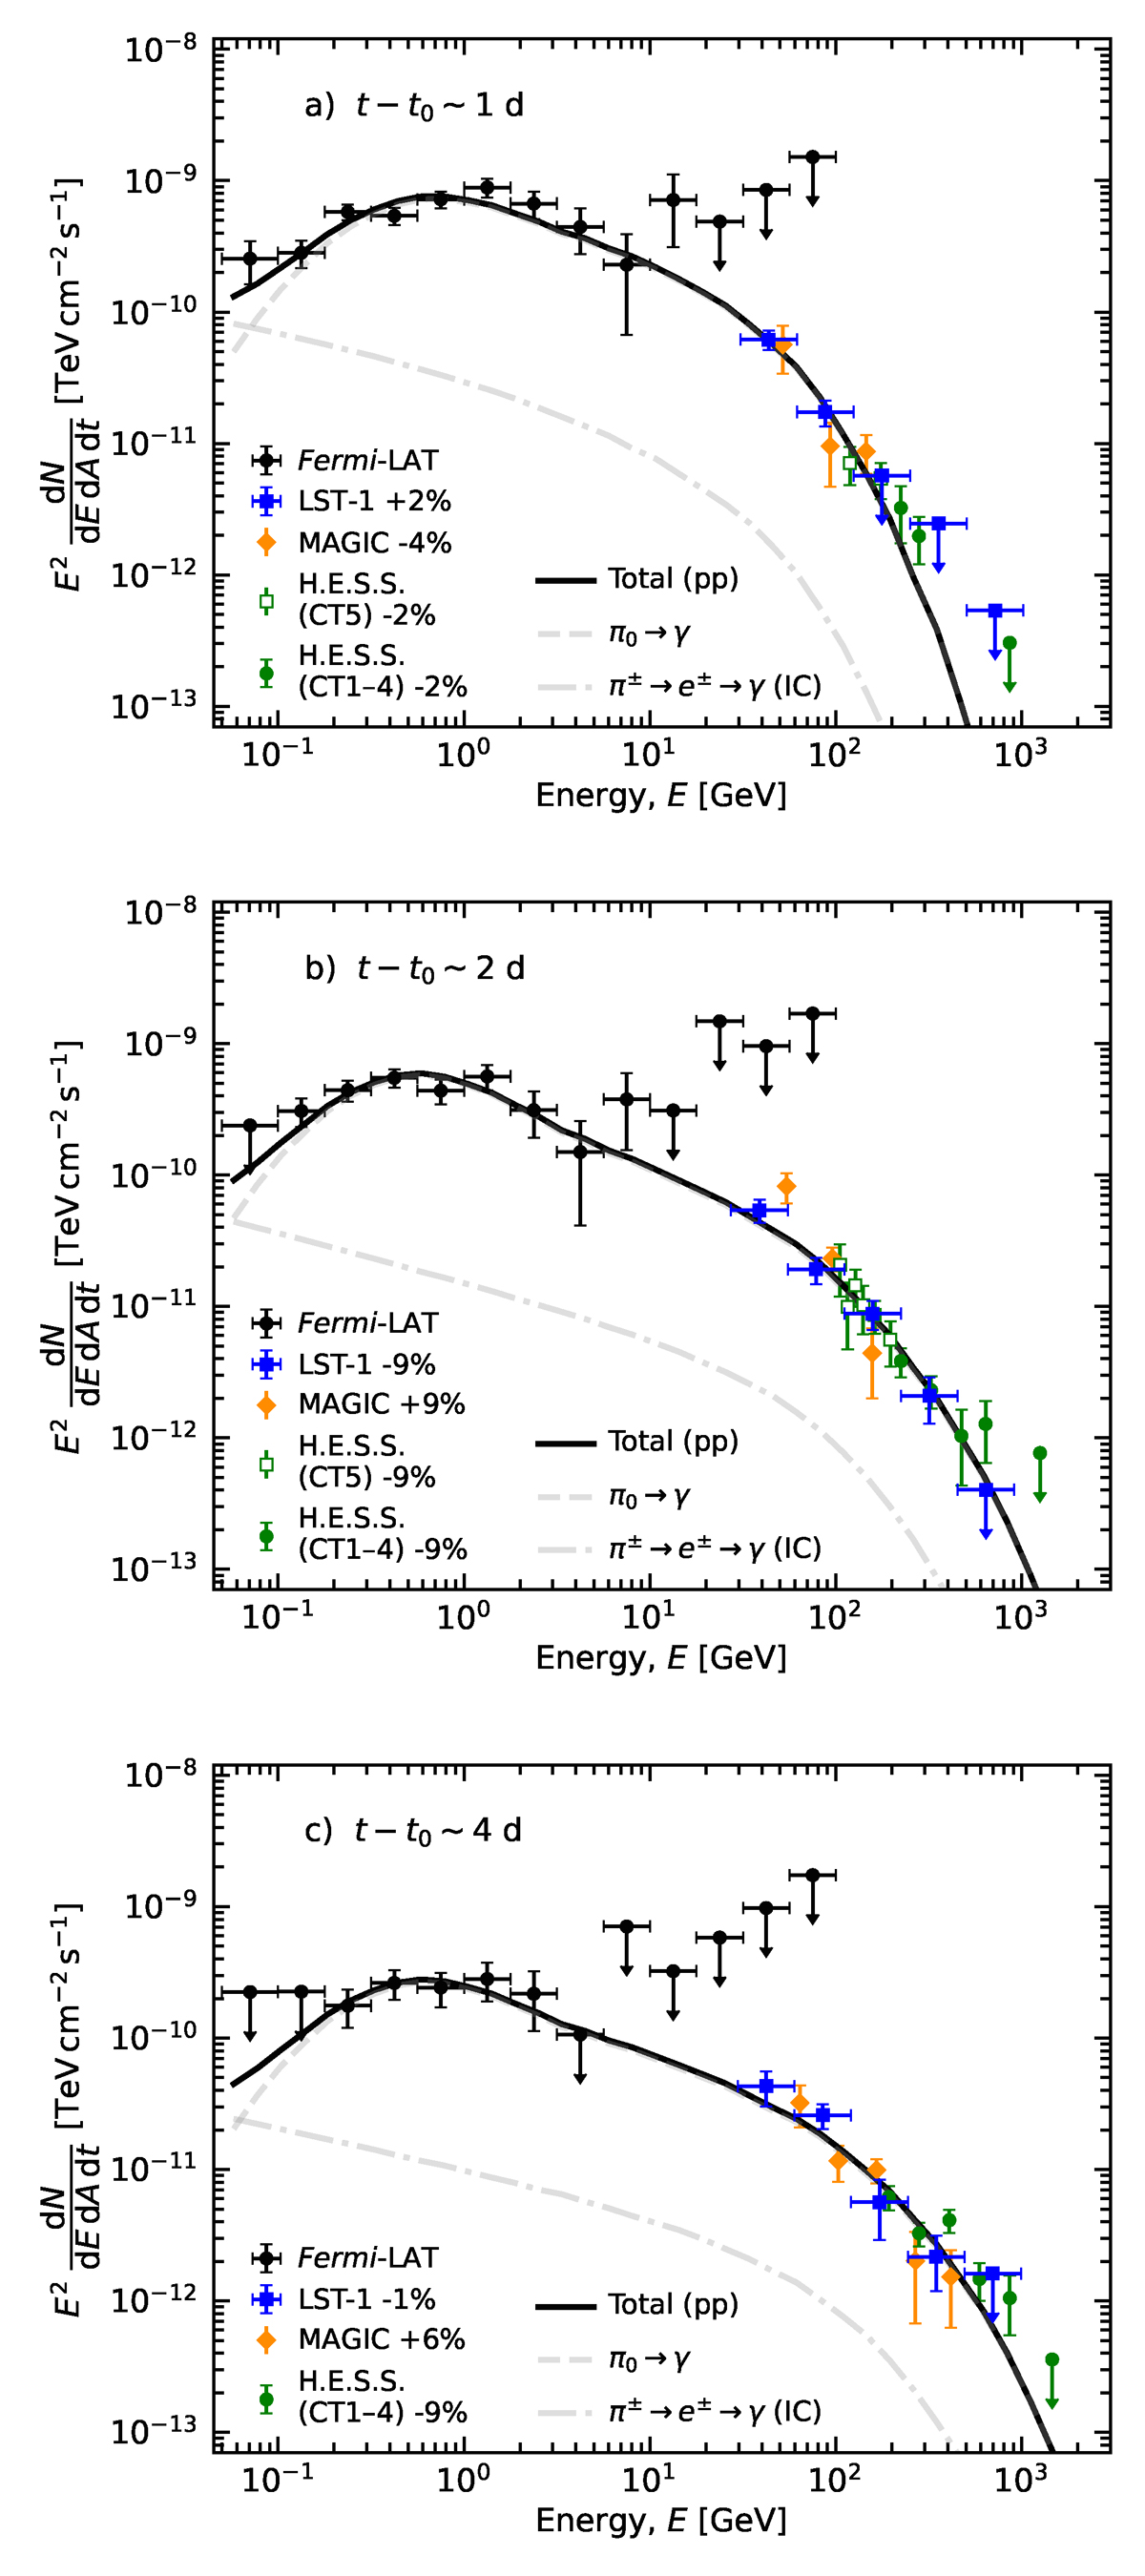
Fig. D.2.
Download original image
Same SEDs as Fig. 3 but with the IACT SED points scaled to account for the systematic energy scaling factors obtained for the best-fit hadronic model with systematics. The systematic value for each IACT is shown in the legend. In addition, the best-fit hadronic model considering energy-scale systematics is displayed as a black curve. The corresponding contributions from neutral and charged-pion decays are shown in grey.
Current usage metrics show cumulative count of Article Views (full-text article views including HTML views, PDF and ePub downloads, according to the available data) and Abstracts Views on Vision4Press platform.
Data correspond to usage on the plateform after 2015. The current usage metrics is available 48-96 hours after online publication and is updated daily on week days.
Initial download of the metrics may take a while.