Open Access
Fig. B.1.
Download original image
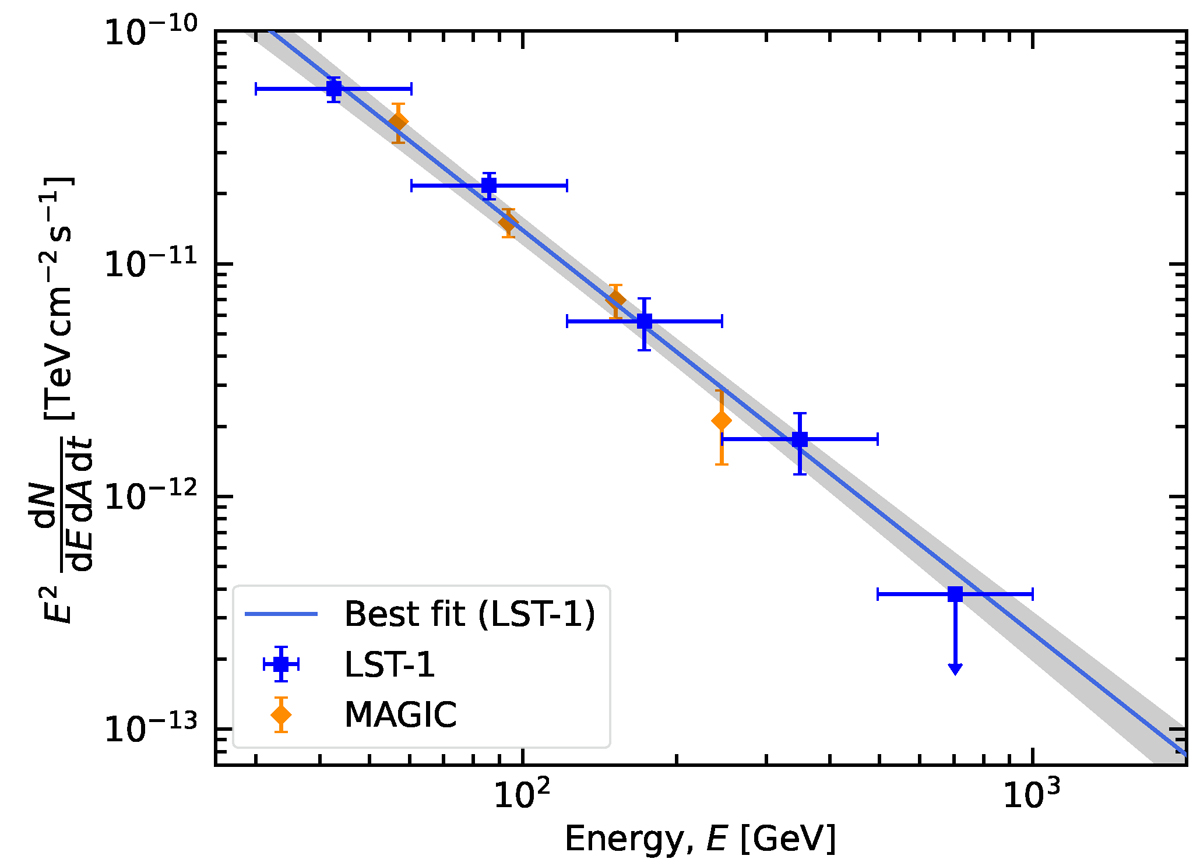
SED at VHE gamma rays obtained with LST-1 (blue squares) and MAGIC (orange diamonds; Acciari et al. 2022) using all observations between observation-day intervals t − t0 ∼ [1, 4] d (see Table 1 for LST-1). The best-fit model for LST-1 is displayed as a blue line together with a grey spectral error band.
Current usage metrics show cumulative count of Article Views (full-text article views including HTML views, PDF and ePub downloads, according to the available data) and Abstracts Views on Vision4Press platform.
Data correspond to usage on the plateform after 2015. The current usage metrics is available 48-96 hours after online publication and is updated daily on week days.
Initial download of the metrics may take a while.