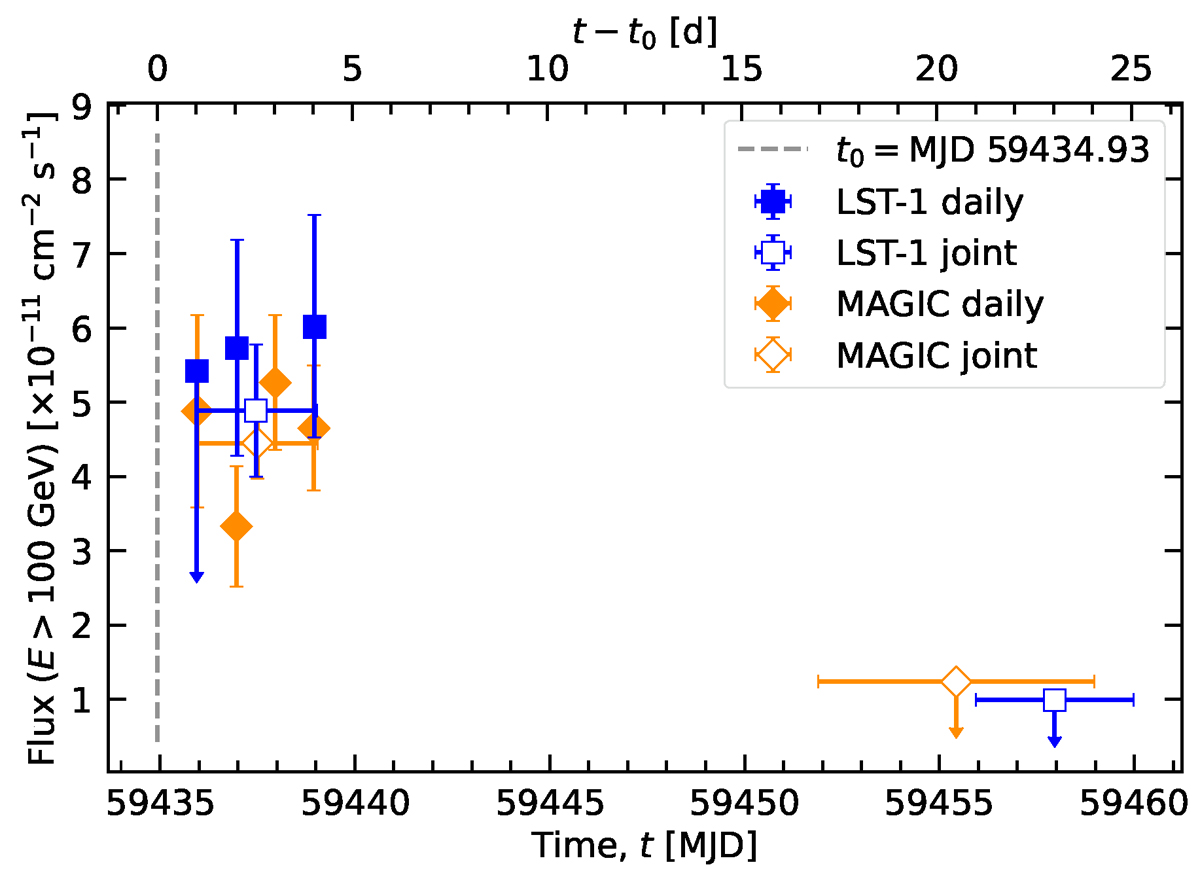
Fig. 2.
Download original image
Daily integral fluxes at E > 100 GeV for LST-1 (filled blue squares) and MAGIC (filled orange diamonds; Acciari et al. 2022) as a function of MJD (bottom axis) and time after the eruption onset (top axis), which is represented as the dashed line. We also show the joint LST-1 (empty blue squares) and the joint MAGIC (empty orange diamonds) integral fluxes during observation-day intervals 1 and 4, and more than 21 days after the eruption.
Current usage metrics show cumulative count of Article Views (full-text article views including HTML views, PDF and ePub downloads, according to the available data) and Abstracts Views on Vision4Press platform.
Data correspond to usage on the plateform after 2015. The current usage metrics is available 48-96 hours after online publication and is updated daily on week days.
Initial download of the metrics may take a while.