Open Access
Fig. A.3.
Download original image
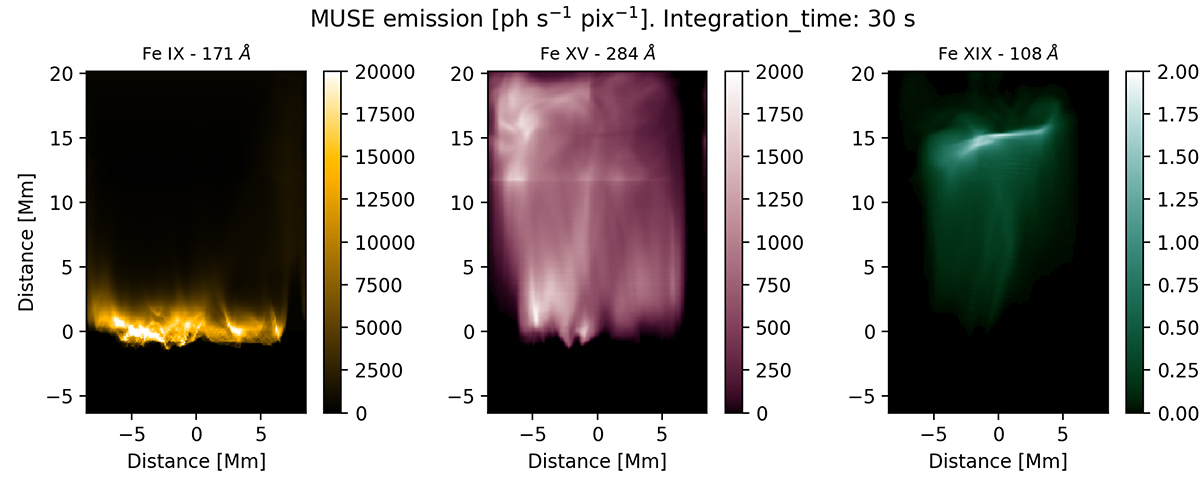
Synthetic maps of MUSE emission integrated along a line of sight from a side view of the curved loop system for the Fe IX 171 Å, Fe XV 284 Å, and Fe XIX 108 Å lines, respectively (see Movie A2).
Current usage metrics show cumulative count of Article Views (full-text article views including HTML views, PDF and ePub downloads, according to the available data) and Abstracts Views on Vision4Press platform.
Data correspond to usage on the plateform after 2015. The current usage metrics is available 48-96 hours after online publication and is updated daily on week days.
Initial download of the metrics may take a while.