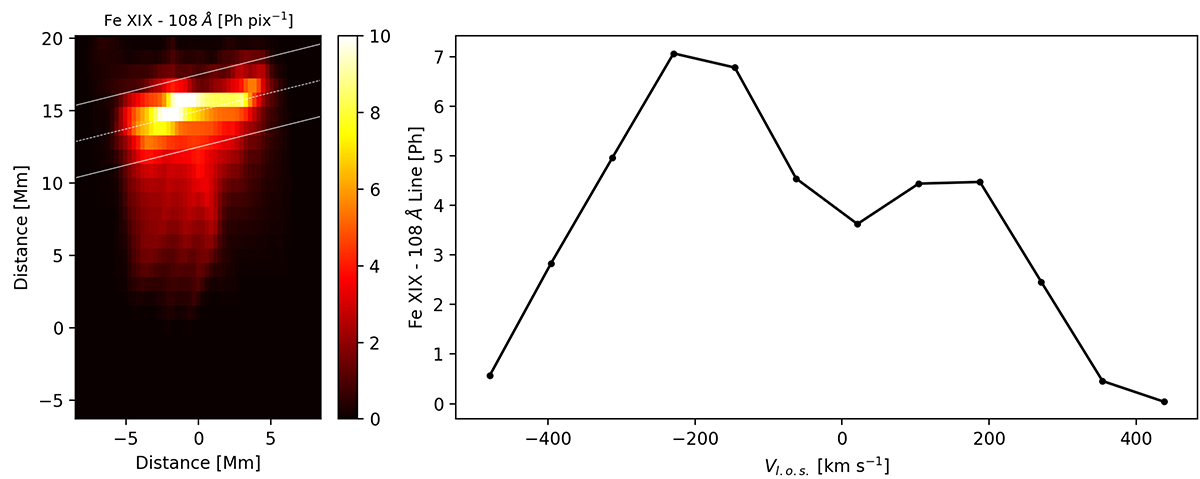
Fig. 6.
Download original image
MUSE synthetic map and spectrum (line of sight shown in the Fig. 5). Left: the Fe XIX 108 Å line emission map as in Fig. 5. The emission is integrated over macro-pixels with a size of Δh = 0.28 Mm, Δv = 1.89 Mm (0.4″ × 2.7″) (exposure time: 30 s). Right: Fe XIX line spectrum obtained by integrating the emission along the volume marked in the map on the left (white solid lines, cross-section 5 × 5 Mm). The spectral bin is Δv = 80 km s−1. We account for thermal, non-thermal, and instrumental broadening.
Current usage metrics show cumulative count of Article Views (full-text article views including HTML views, PDF and ePub downloads, according to the available data) and Abstracts Views on Vision4Press platform.
Data correspond to usage on the plateform after 2015. The current usage metrics is available 48-96 hours after online publication and is updated daily on week days.
Initial download of the metrics may take a while.