Fig. 5.
Download original image
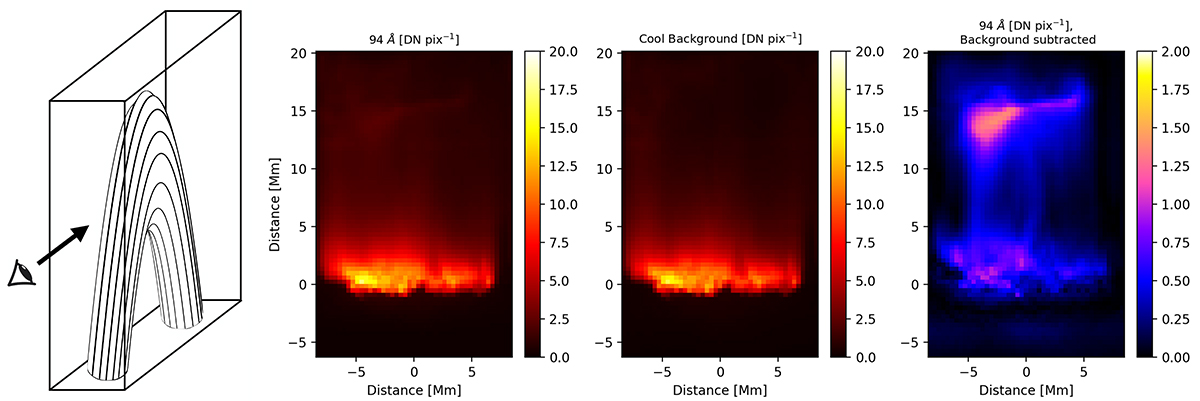
Synthetic maps in the AIA 94 Å channel integrated along a line of sight from a side view of the curved loop system (first panel, exposure time: 9 s). Second panel: In this geometry the top of the loop is high in the image, as shown in the left panel. intensity map in the entire filter band. Third panel: intensity map of the cool component (∼1 MK). Fourth panel: map of the hot (Fe XVIII) component only, after subtracting the middle from the left.
Current usage metrics show cumulative count of Article Views (full-text article views including HTML views, PDF and ePub downloads, according to the available data) and Abstracts Views on Vision4Press platform.
Data correspond to usage on the plateform after 2015. The current usage metrics is available 48-96 hours after online publication and is updated daily on week days.
Initial download of the metrics may take a while.