Fig. A.5.
Download original image
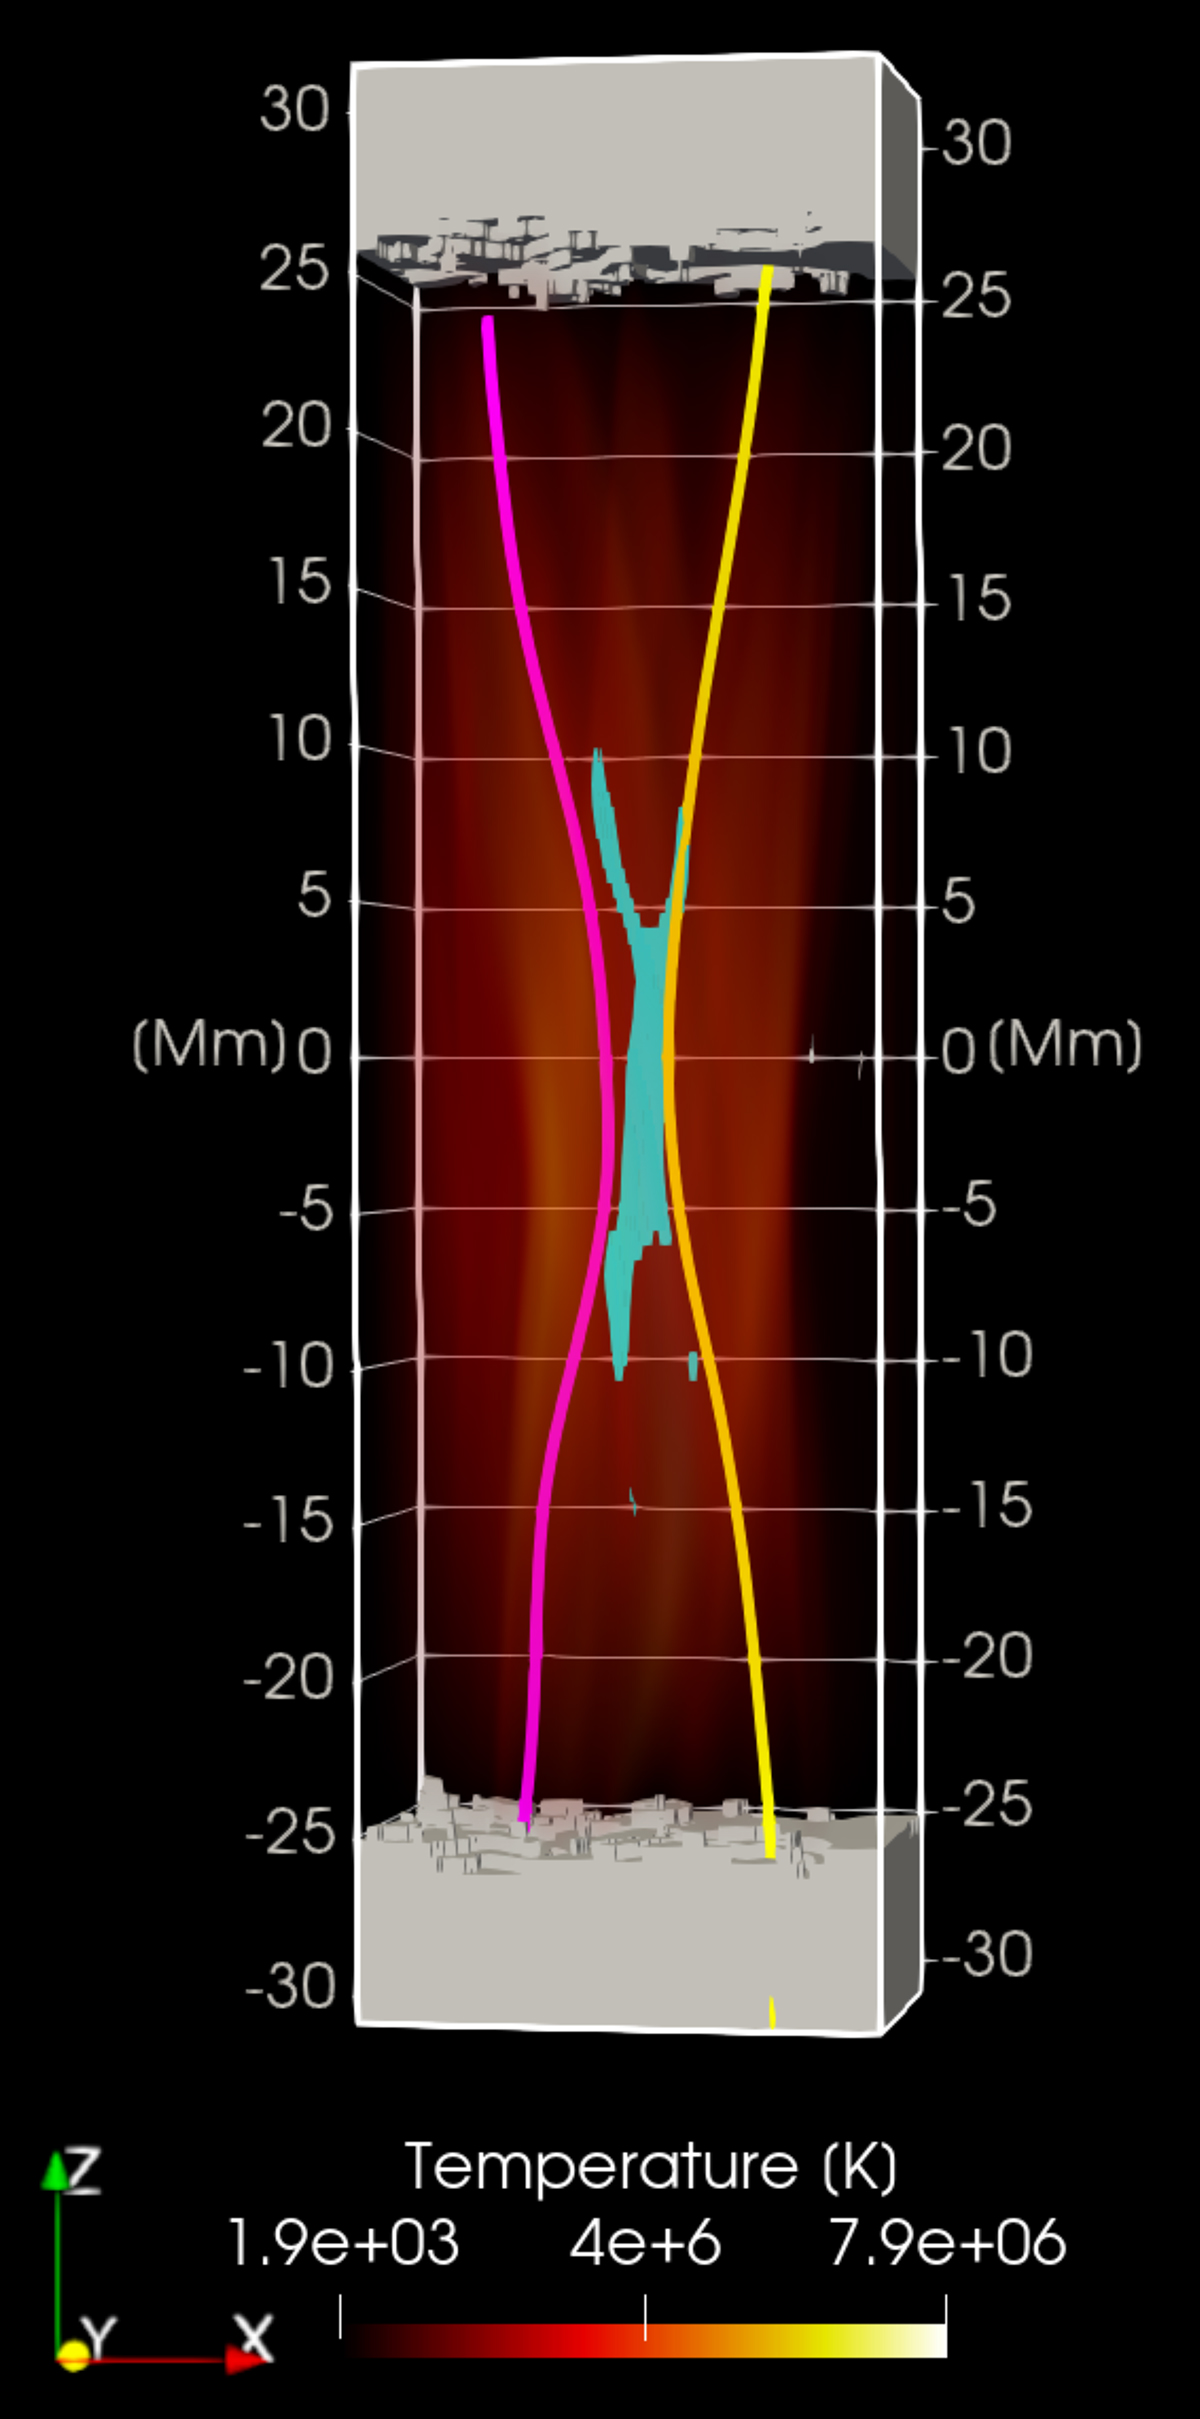
3D rendering of the analysed magnetic reconnection region. Field lines are the same as in the second panel of Fig. 2 (t = 10 s). The temperature (red) is shown in the background. Here we also show the diffusion region DR (pale blue, Fig. 1) defined by the region where where E ⋅ B ≠ 0. The solid blocks at the top and bottom are the footpoints in the chromosphere.
Current usage metrics show cumulative count of Article Views (full-text article views including HTML views, PDF and ePub downloads, according to the available data) and Abstracts Views on Vision4Press platform.
Data correspond to usage on the plateform after 2015. The current usage metrics is available 48-96 hours after online publication and is updated daily on week days.
Initial download of the metrics may take a while.