Fig. 5
Download original image
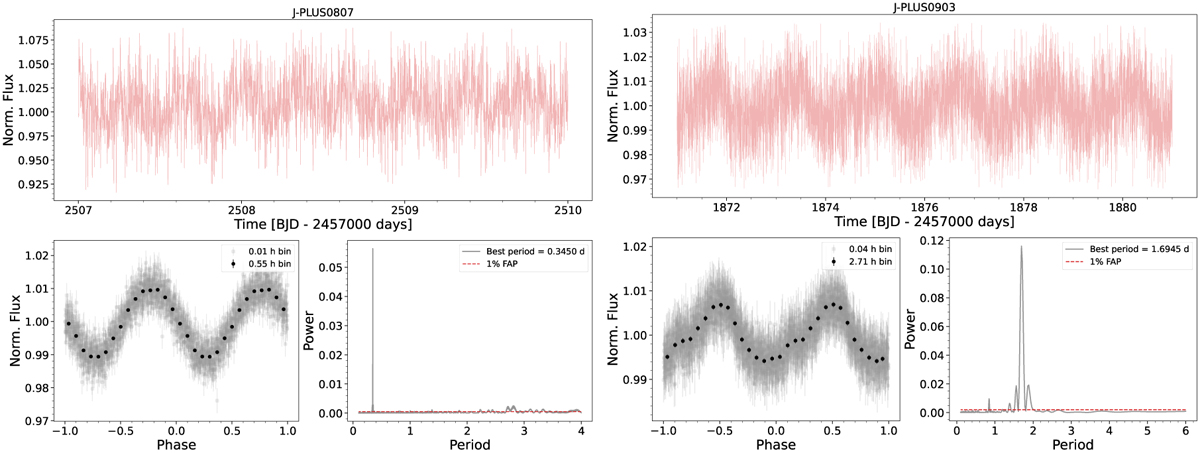
TESS LCs (top panels), phase-folded LCs (bottom-left panels), and periodograms (bottom-right panels) for our two targets. The top panels show only a small section of the LCs for better visibility. Two different bin sizes are shown for the binned phase-folded LCs, with grey and black dots. In the periodograms, the dashed red line represents the 1% false alarm probability level.
Current usage metrics show cumulative count of Article Views (full-text article views including HTML views, PDF and ePub downloads, according to the available data) and Abstracts Views on Vision4Press platform.
Data correspond to usage on the plateform after 2015. The current usage metrics is available 48-96 hours after online publication and is updated daily on week days.
Initial download of the metrics may take a while.