Open Access
Fig. 2
Download original image
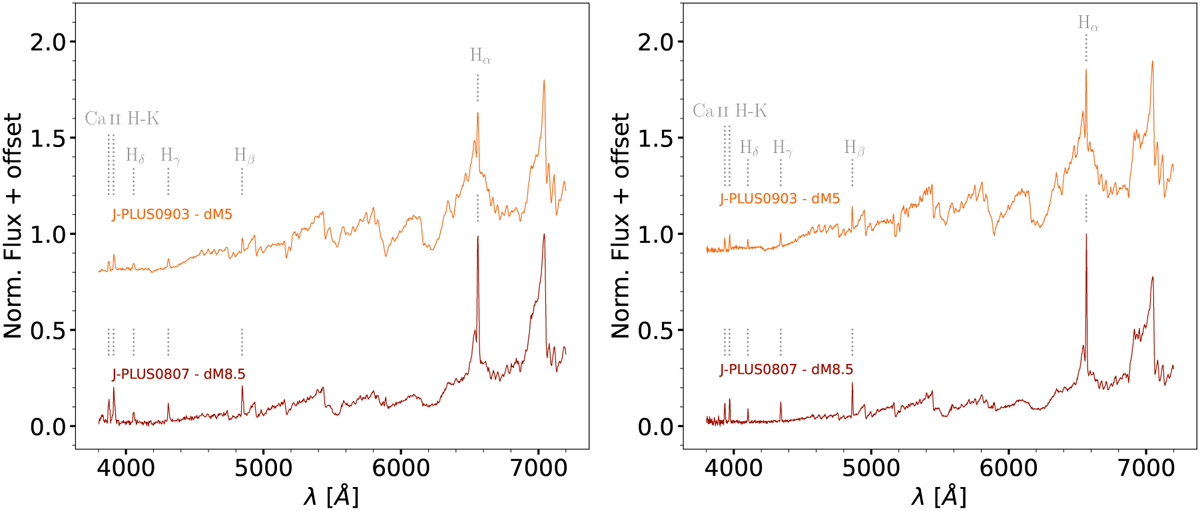
Zoomed-in view of the NOT/ALFOSC (left panel) and GTC/OSIRIS (right panel) co-added spectra of J-PLUS0807 and J-PLUS0903. The grey dashed lines mark Ca II H and K, Hδ, Hγ, Hβ, and Hα emission lines.
Current usage metrics show cumulative count of Article Views (full-text article views including HTML views, PDF and ePub downloads, according to the available data) and Abstracts Views on Vision4Press platform.
Data correspond to usage on the plateform after 2015. The current usage metrics is available 48-96 hours after online publication and is updated daily on week days.
Initial download of the metrics may take a while.