Open Access
Fig. 1
Download original image
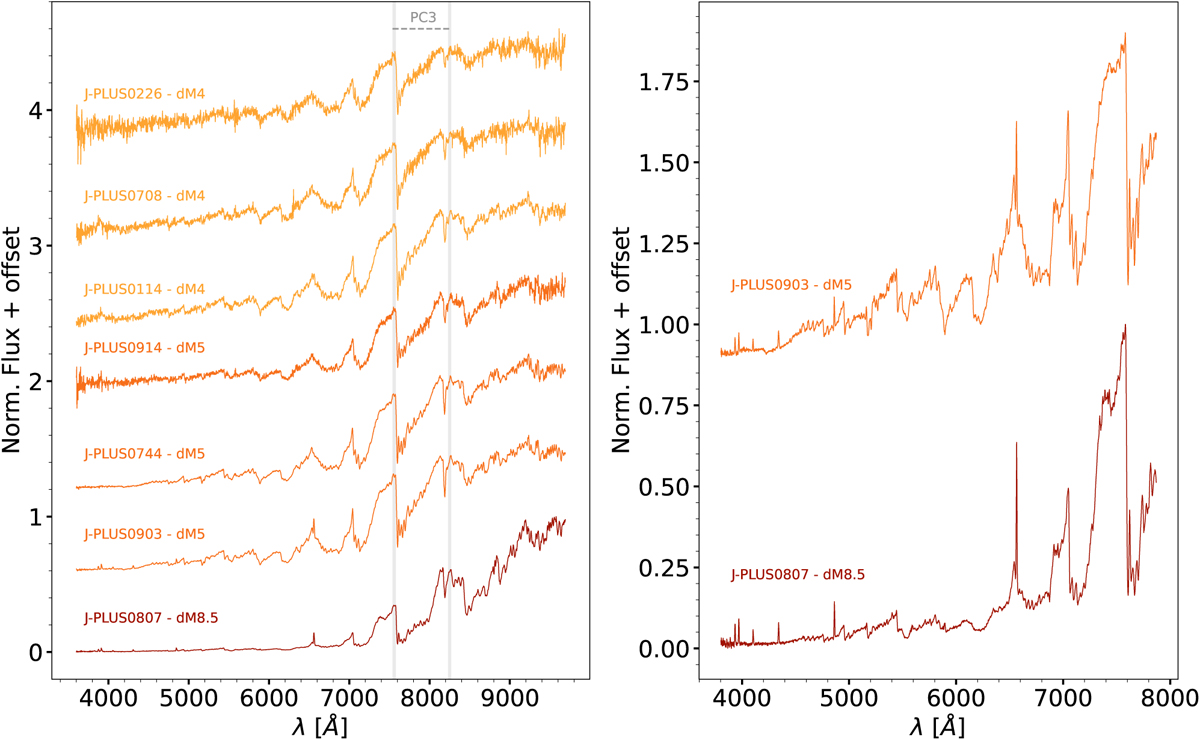
Co-added spectra observed with NOT/ALFOSC (left panel) and GTC/OSIRIS (right panel), sorted from top to bottom by the derived PC3 index (see Table 2). The grey shaded bands in the left panel show the spectral regions used to derive the PC3 index.
Current usage metrics show cumulative count of Article Views (full-text article views including HTML views, PDF and ePub downloads, according to the available data) and Abstracts Views on Vision4Press platform.
Data correspond to usage on the plateform after 2015. The current usage metrics is available 48-96 hours after online publication and is updated daily on week days.
Initial download of the metrics may take a while.