Fig. 8.
Download original image
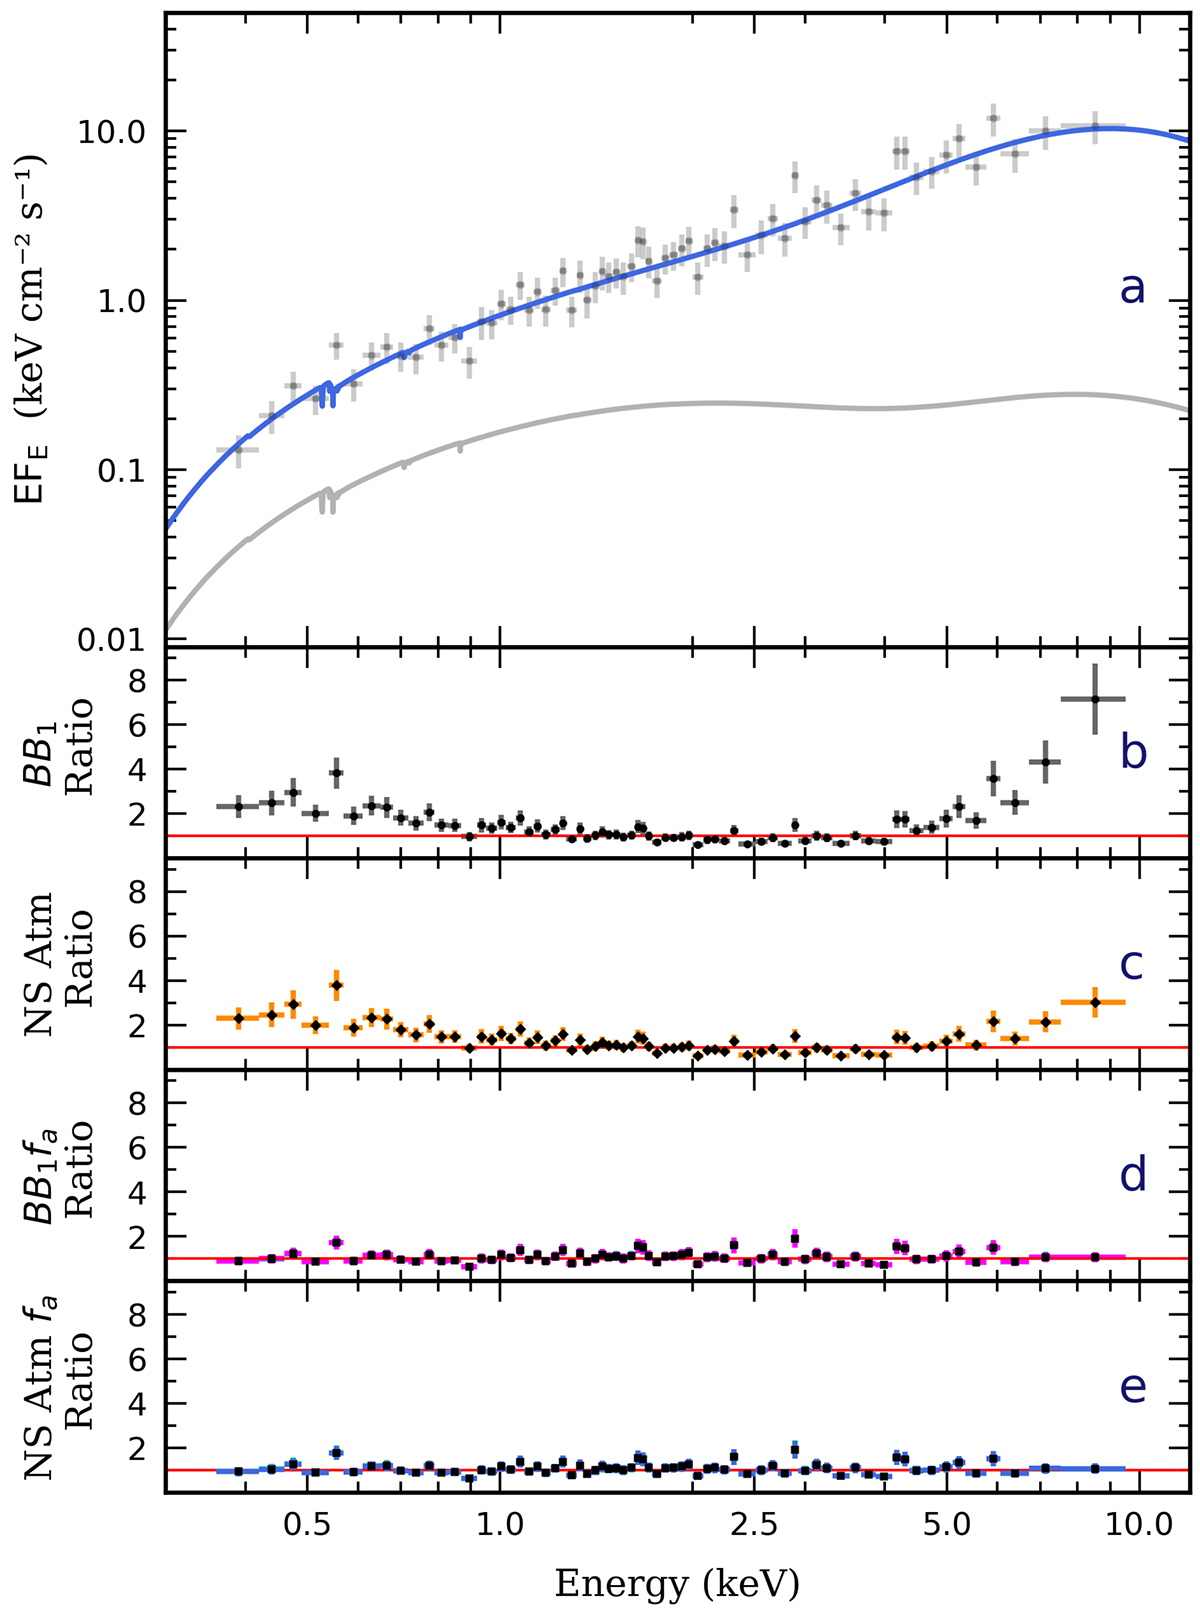
Burst spectral energy distribution and residuals of the first second of burst #4 when fitted by the four used models. Results for other bursts are shown in Fig. A.5. Panel a shows the spectrum, with the continuous blue line representing the NS atmosphere with fa factor model, the continuous gray line representing the pre-burst emission model shown in Fig. 2, and the gray points representing the data. Panel b shows the residuals for the blackbody model. Panel c shows the residuals for the NS atmosphere model. Panel d shows the residuals for the blackbody with fa factor model, with magenta for the constant*(diskbb+comptt) case and cyan for constant*diskbb+comptt case, both with square markers. Since their behavior is similar, the magenta markers overlap the cyan ones. Panel e shows the residuals of the NS atmosphere with fa factor model.
Current usage metrics show cumulative count of Article Views (full-text article views including HTML views, PDF and ePub downloads, according to the available data) and Abstracts Views on Vision4Press platform.
Data correspond to usage on the plateform after 2015. The current usage metrics is available 48-96 hours after online publication and is updated daily on week days.
Initial download of the metrics may take a while.