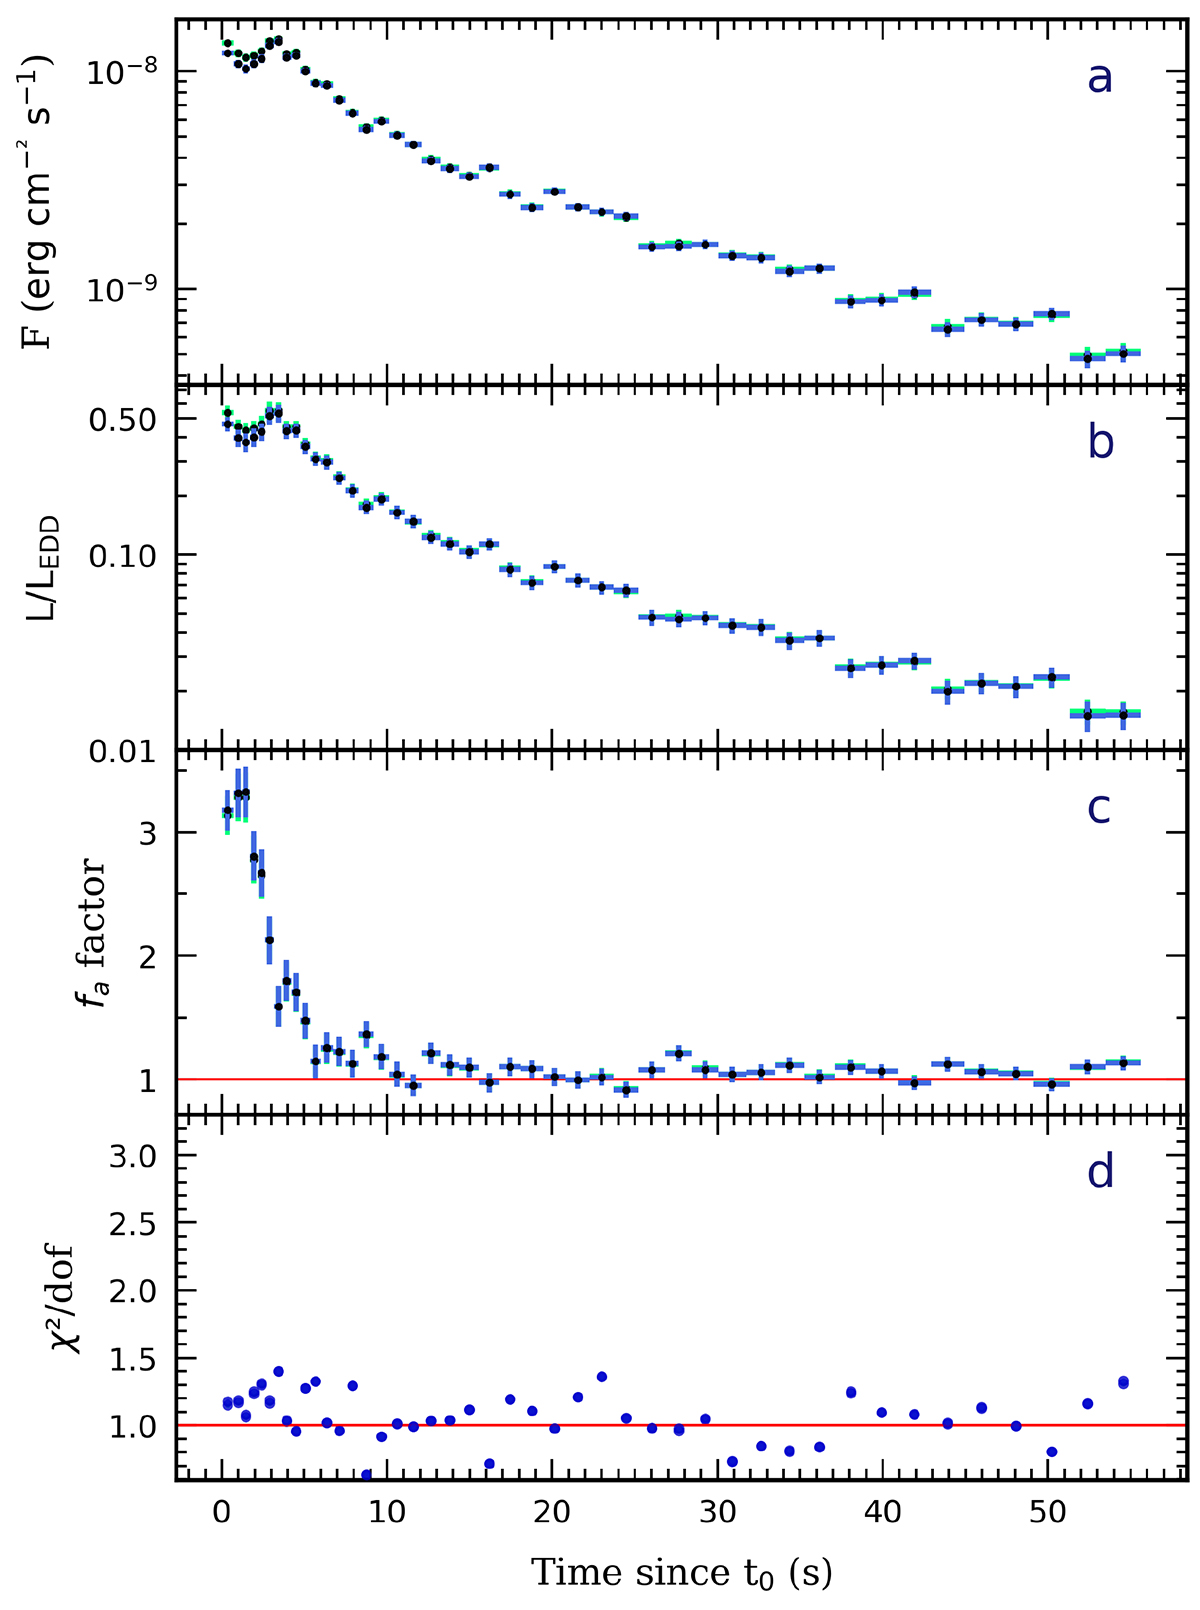
Fig. 7.
Download original image
Time-resolved spectroscopy using the NS atmosphere model in addition to the fa correction for burst #4. Results for other bursts are shown in Fig. A.4. Blue markers are used for the first fa case, constant*(diskbb+comptt) and light green markers for the second fa case, constant*diskbb+comptt. Since their behavior is similar, the blue markers overlap the green ones. Panel a shows the estimated bolometric flux, panel b shows the time evolution of the ratio of luminosity to Eddington luminosity, panel c shows the evolution of the fa factor, and panel d gives the reduced χ2 fit statistic.
Current usage metrics show cumulative count of Article Views (full-text article views including HTML views, PDF and ePub downloads, according to the available data) and Abstracts Views on Vision4Press platform.
Data correspond to usage on the plateform after 2015. The current usage metrics is available 48-96 hours after online publication and is updated daily on week days.
Initial download of the metrics may take a while.