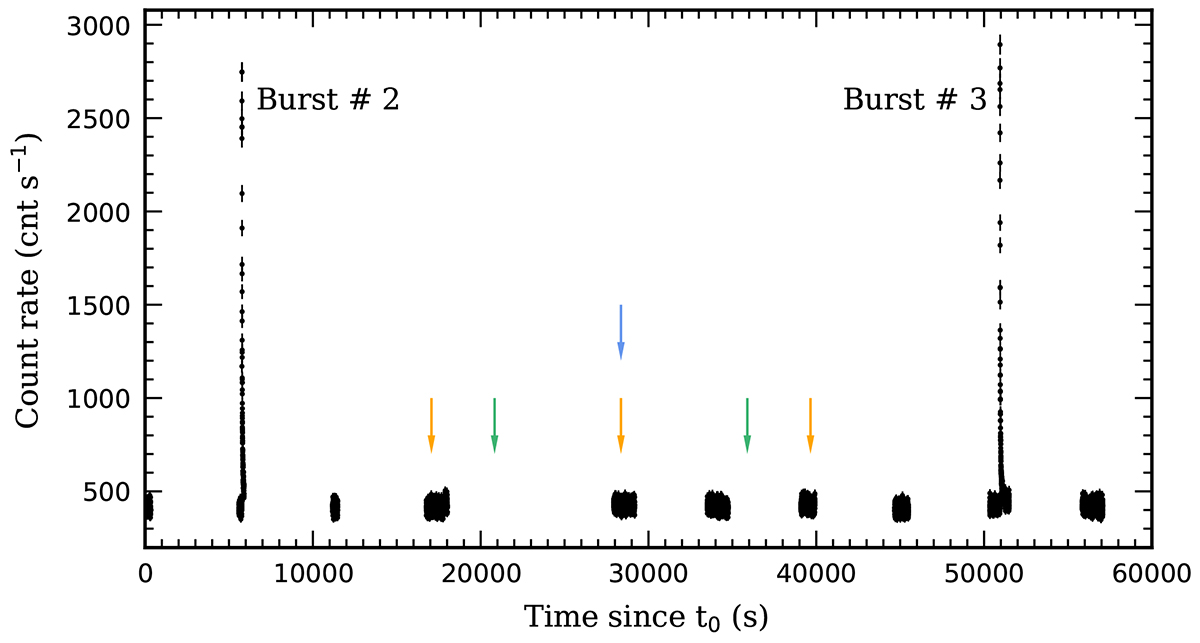
Fig. 4.
Download original image
Cropped light curve of ObsID 5034140110, showing two consecutive X-ray bursts (#2 and #3). Assuming the recurrence time is the interval between the two bursts, the blue arrow indicates where a burst would appear with half the recurrence time, the green arrows where they would appear with a third of the recurrence time, and the orange arrows where they would appear with a fourth of the recurrence time. Time is relative to the onset of the observation t0 = 59859.1880 MJD (TT).
Current usage metrics show cumulative count of Article Views (full-text article views including HTML views, PDF and ePub downloads, according to the available data) and Abstracts Views on Vision4Press platform.
Data correspond to usage on the plateform after 2015. The current usage metrics is available 48-96 hours after online publication and is updated daily on week days.
Initial download of the metrics may take a while.