Open Access
Fig. 3.
Download original image
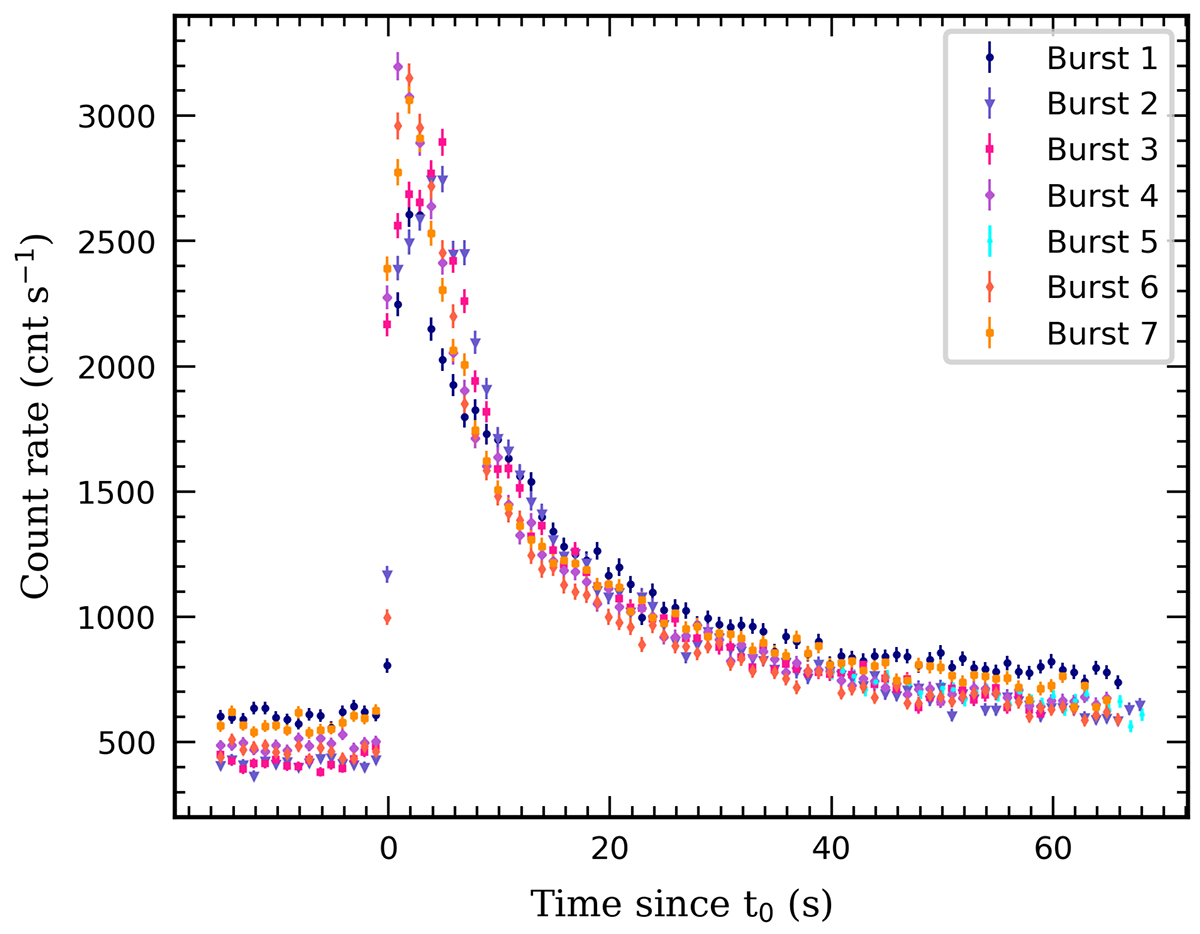
Overlapped light curves of the seven M15 X-2 bursts in the 0.3–10 keV band with 1 s binning. The light curves are aligned by the burst onset (t0). Each color and symbol represents a different burst. For burst 5, only the tail was observed, so it was manually positioned to match the morphology of the other bursts.
Current usage metrics show cumulative count of Article Views (full-text article views including HTML views, PDF and ePub downloads, according to the available data) and Abstracts Views on Vision4Press platform.
Data correspond to usage on the plateform after 2015. The current usage metrics is available 48-96 hours after online publication and is updated daily on week days.
Initial download of the metrics may take a while.