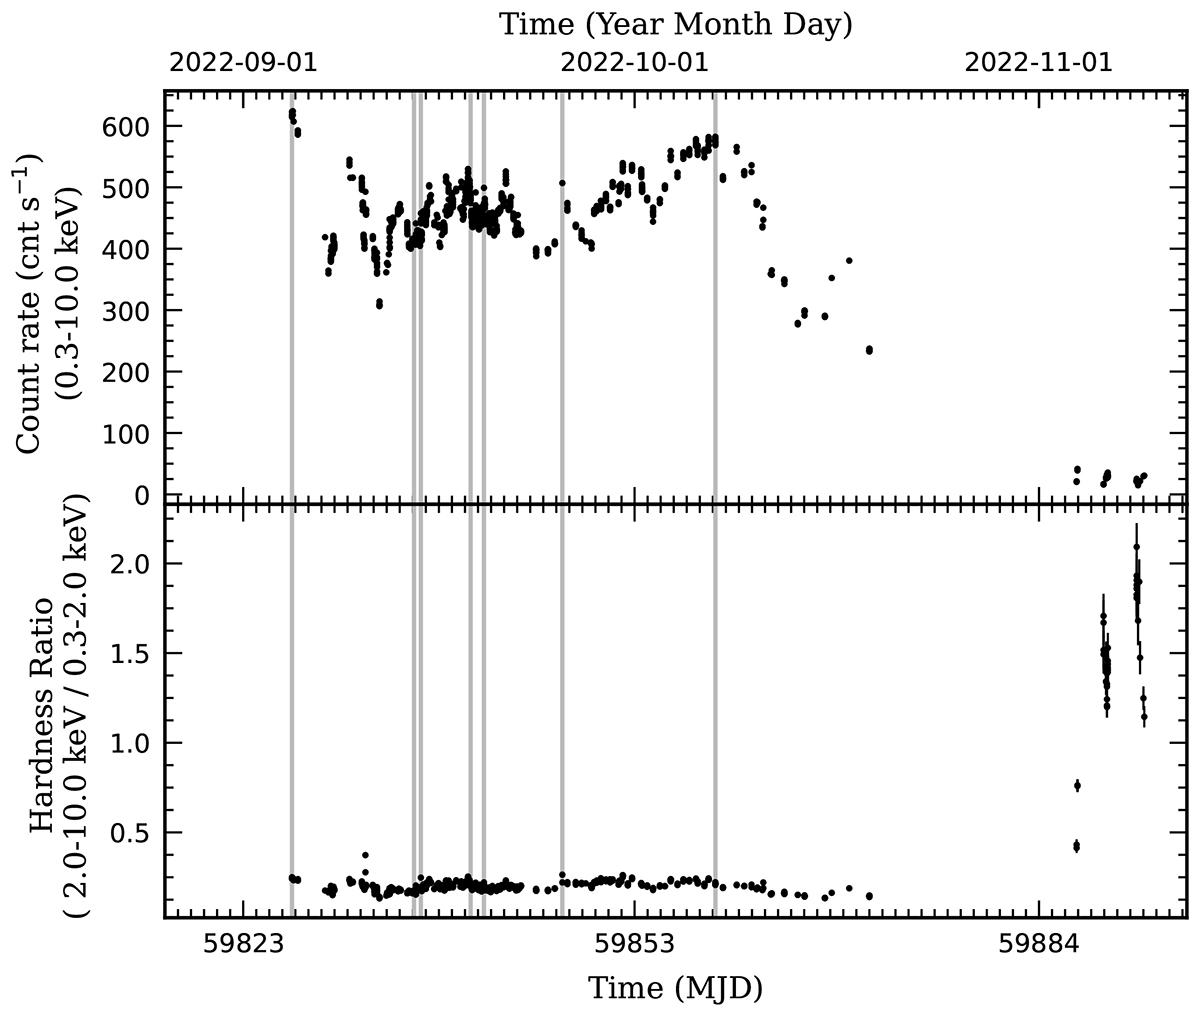
Fig. 1.
Download original image
Properties of M15 X-2 outburst detected by NICER in the 0.3–10 keV energy band. Top panel: the light curve. Bottom panel: Hardness ratio of the count rates between the 2–10 and 0.3–2.0 keV energy bands. The X-ray bursts have been removed from the light curve, but the detection time of each burst is marked with a grey vertical line. For the fifth burst, only the tail was observed, so the onset is an approximation based on Fig. 3.
Current usage metrics show cumulative count of Article Views (full-text article views including HTML views, PDF and ePub downloads, according to the available data) and Abstracts Views on Vision4Press platform.
Data correspond to usage on the plateform after 2015. The current usage metrics is available 48-96 hours after online publication and is updated daily on week days.
Initial download of the metrics may take a while.