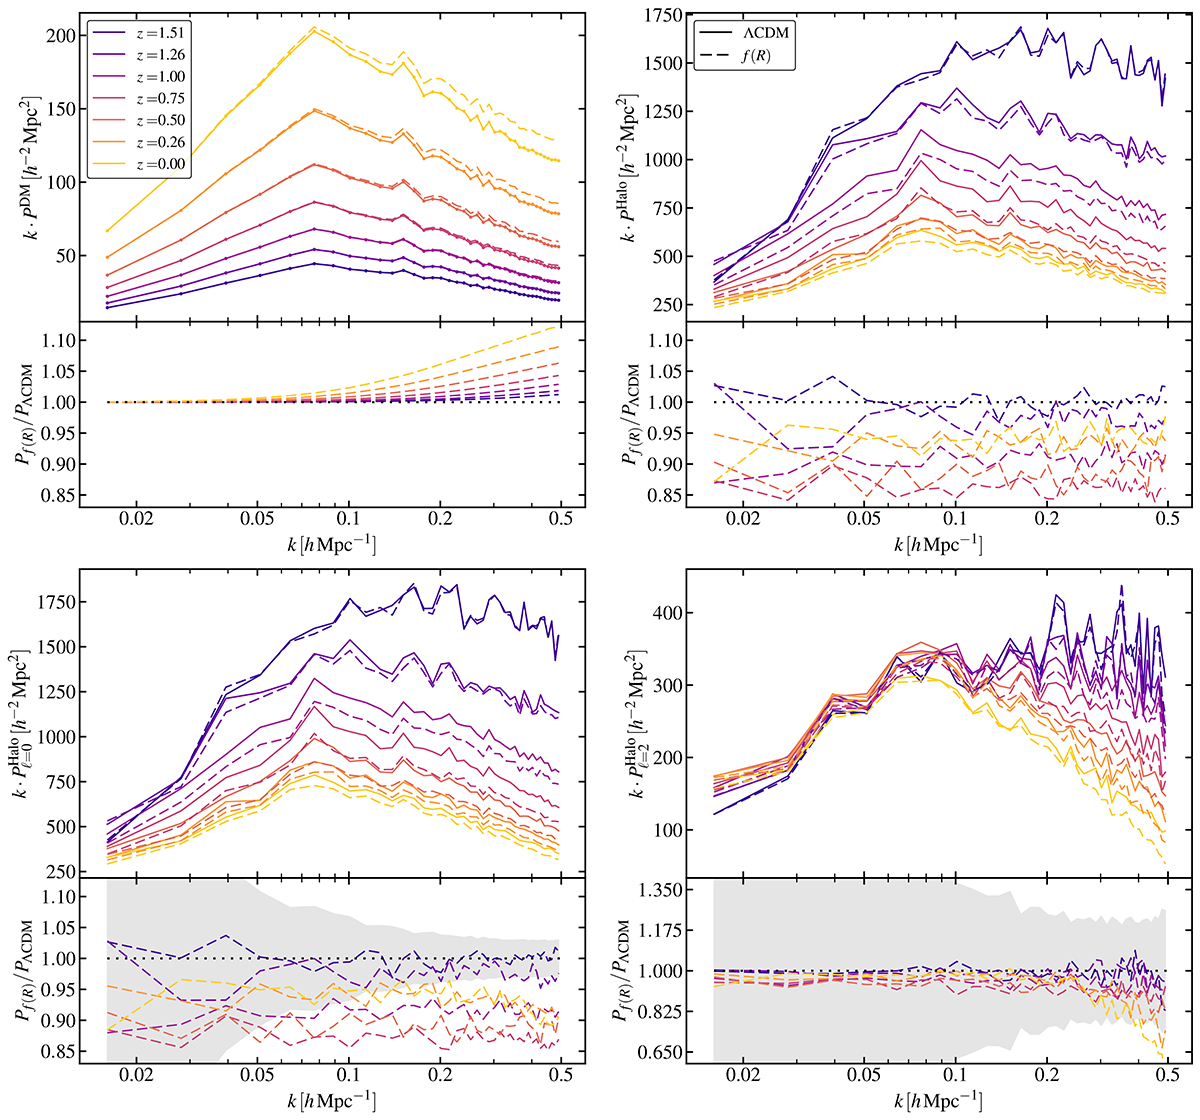
Fig. 5.
Download original image
Calculated matter and halo power spectra from the FORGE simulation suite in the mass bin 1012.7h−1 M⊙ < Mhalo < 1013.2h−1 M⊙. The solid lines represent the reference ΛCDM simulations, while the dashed lines are the results of the nDGP simulations. Top left: Real-space power spectra for dark matter. The dots above the solid lines highlight the locations where the power spectrum is estimated. Top right: Real-space power spectra for haloes. Bottom left: Monopole of the halo power spectrum in redshift space. The shaded region shows the calculated variance of the monopole of the ΛCDM halo power spectrum at redshift z = 0. Bottom right: Quadrupole of the halo power spectrum in redshift space. The shaded region represents the calculated variance of the quadrupole of the ΛCDM halo power spectrum at redshift z = 0.
Current usage metrics show cumulative count of Article Views (full-text article views including HTML views, PDF and ePub downloads, according to the available data) and Abstracts Views on Vision4Press platform.
Data correspond to usage on the plateform after 2015. The current usage metrics is available 48-96 hours after online publication and is updated daily on week days.
Initial download of the metrics may take a while.