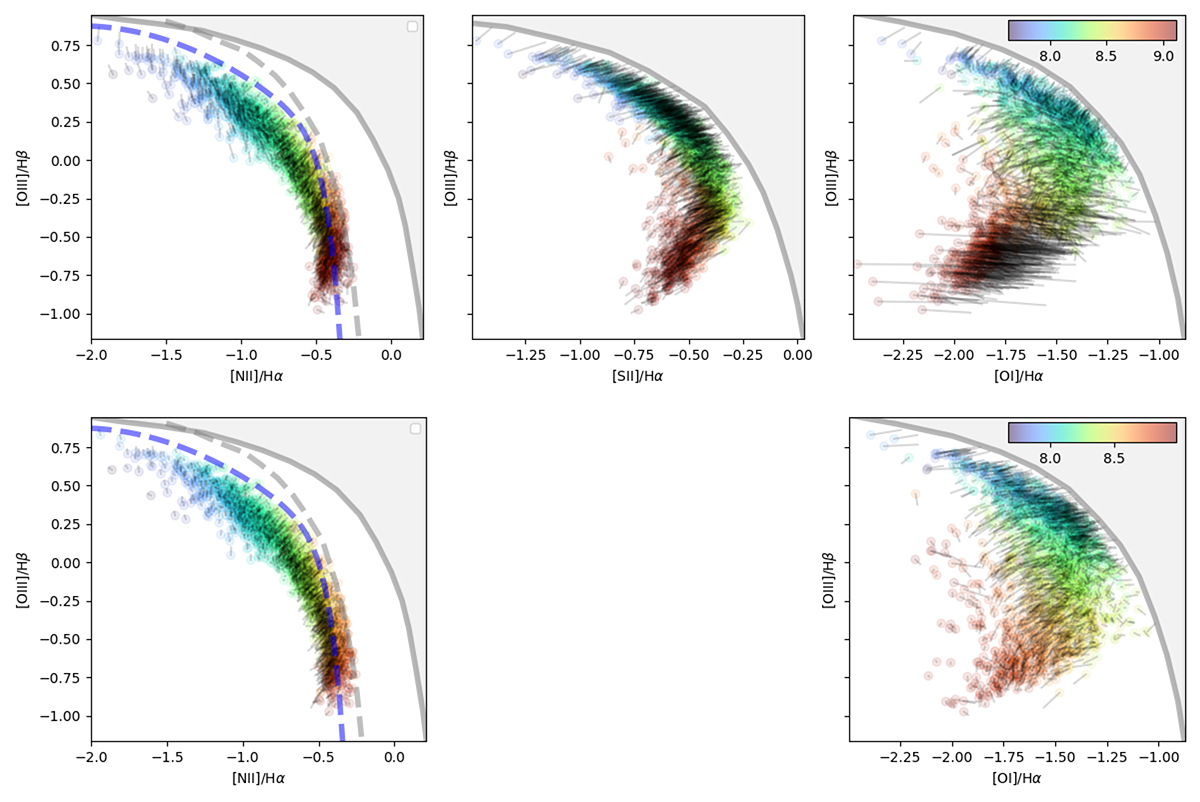
Fig. 3.
Download original image
Excitation diagrams for the inference run with (top) and without (bottom) [S II] lines. The color points show the modeled values (see Sect. 3.3.2), with the color scaling with the metallicity. The solid gray curves show the extreme starburst delimiting line from Kewley et al. (2001), while the dashed gray curve is from Kauffmann et al. (2003), and the dashed blue curve is from Stasińska et al. (2006). The thin black lines shows the distance between the observed and modeled ratios. For [N II]/Hα we use the specific prescription from P22 using both [N II] lines with a scaling factor.
Current usage metrics show cumulative count of Article Views (full-text article views including HTML views, PDF and ePub downloads, according to the available data) and Abstracts Views on Vision4Press platform.
Data correspond to usage on the plateform after 2015. The current usage metrics is available 48-96 hours after online publication and is updated daily on week days.
Initial download of the metrics may take a while.