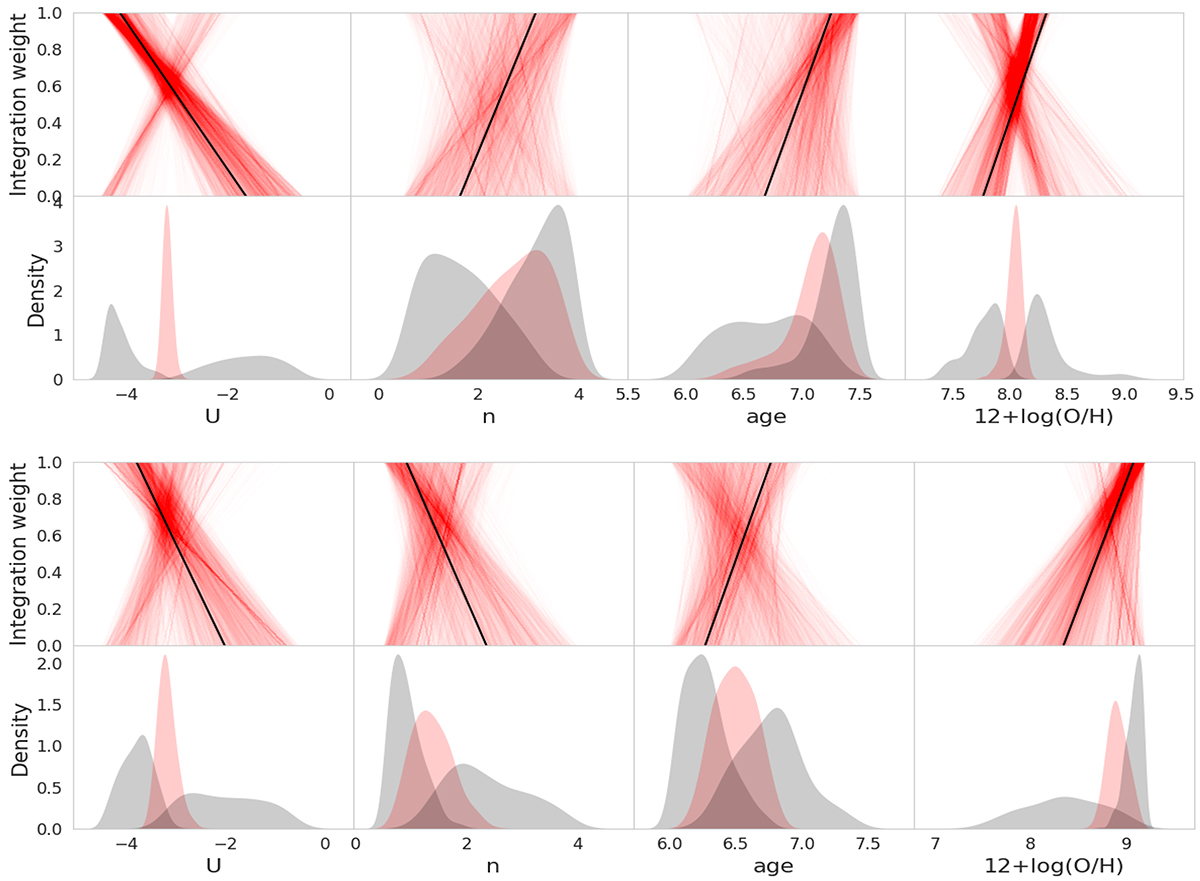
Fig. B.2.
Download original image
Illustration of inferred power-law distributions for typical subsolar metallicity (on top) and super-solar metallicity (on bottom) galaxies. For each metallicity case we show the individual draws for the integration weight (Φ(p); Eqn. 2) on top and the PDF for the lower and upper boundaries for integration (pmin, max; gray) and the average parameter value (pavg; red) the bottom).
Current usage metrics show cumulative count of Article Views (full-text article views including HTML views, PDF and ePub downloads, according to the available data) and Abstracts Views on Vision4Press platform.
Data correspond to usage on the plateform after 2015. The current usage metrics is available 48-96 hours after online publication and is updated daily on week days.
Initial download of the metrics may take a while.