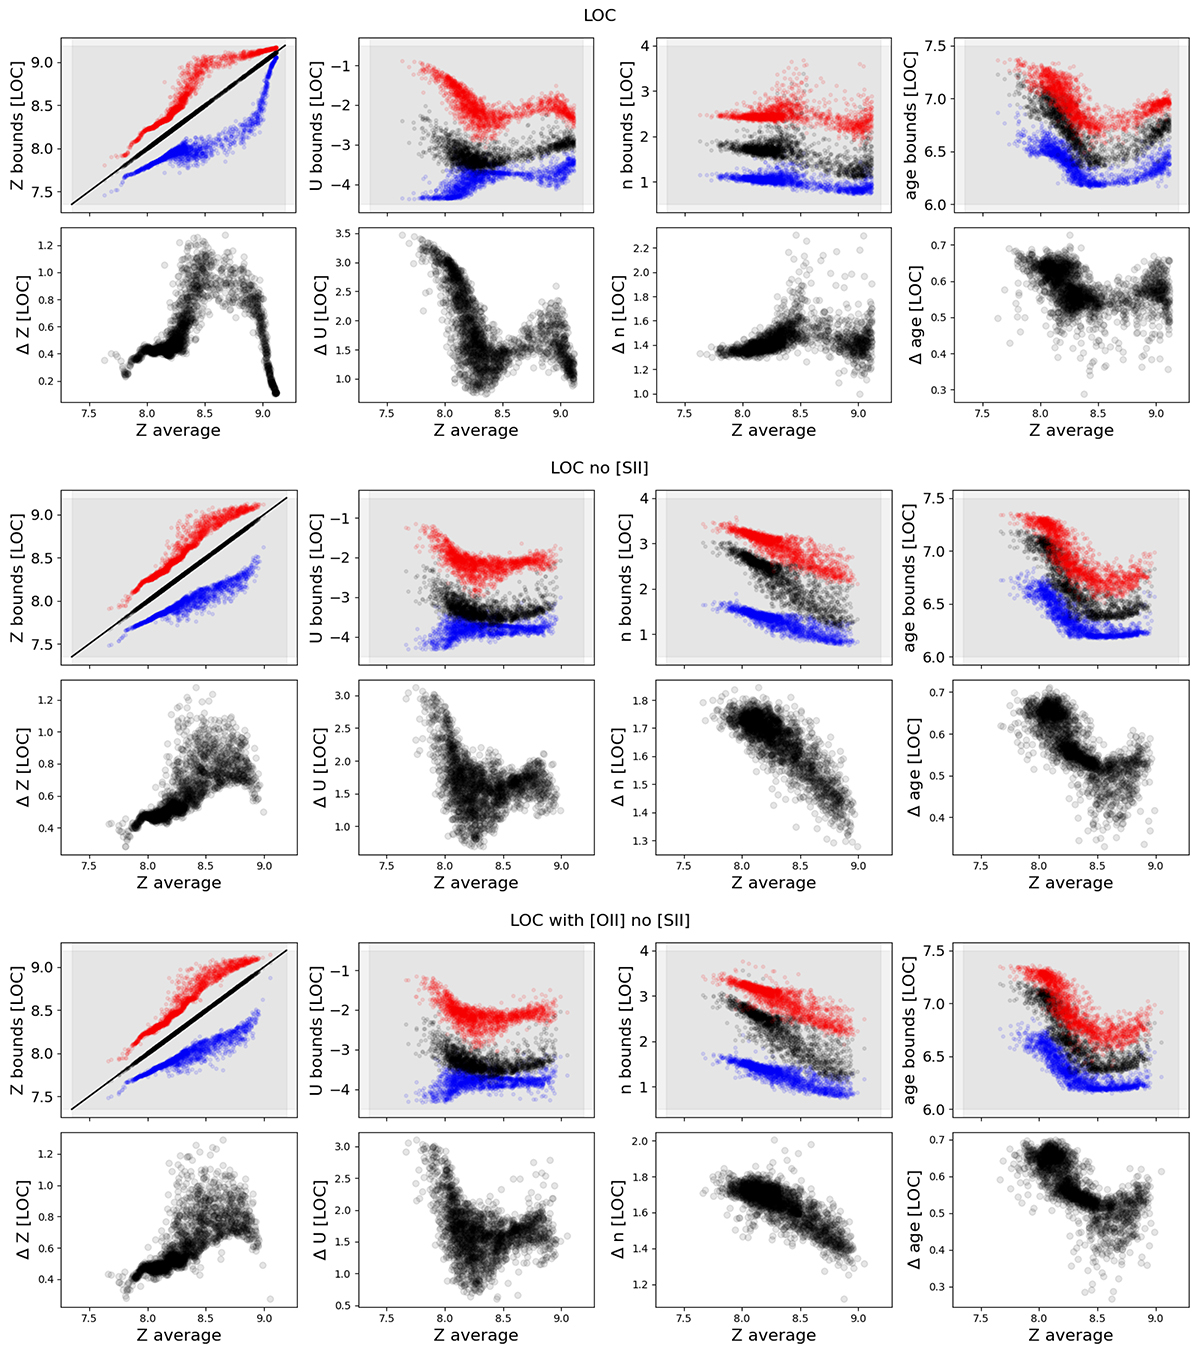
Fig. 11.
Download original image
Evolution of the parameter boundaries pmin, max versus the average metallicity Zavg for the three inference runs (including [S II] on top, ignoring [S II] in the middle, and replacing [S II] by [O II] in the bottom). For each run, the upper row shows pmin, max in blue and red respectively (with the gray rectangles showing the full parameter range in the grid), while the bottom row shows the difference between pmax − pmin.
Current usage metrics show cumulative count of Article Views (full-text article views including HTML views, PDF and ePub downloads, according to the available data) and Abstracts Views on Vision4Press platform.
Data correspond to usage on the plateform after 2015. The current usage metrics is available 48-96 hours after online publication and is updated daily on week days.
Initial download of the metrics may take a while.