Fig. 7.
Download original image
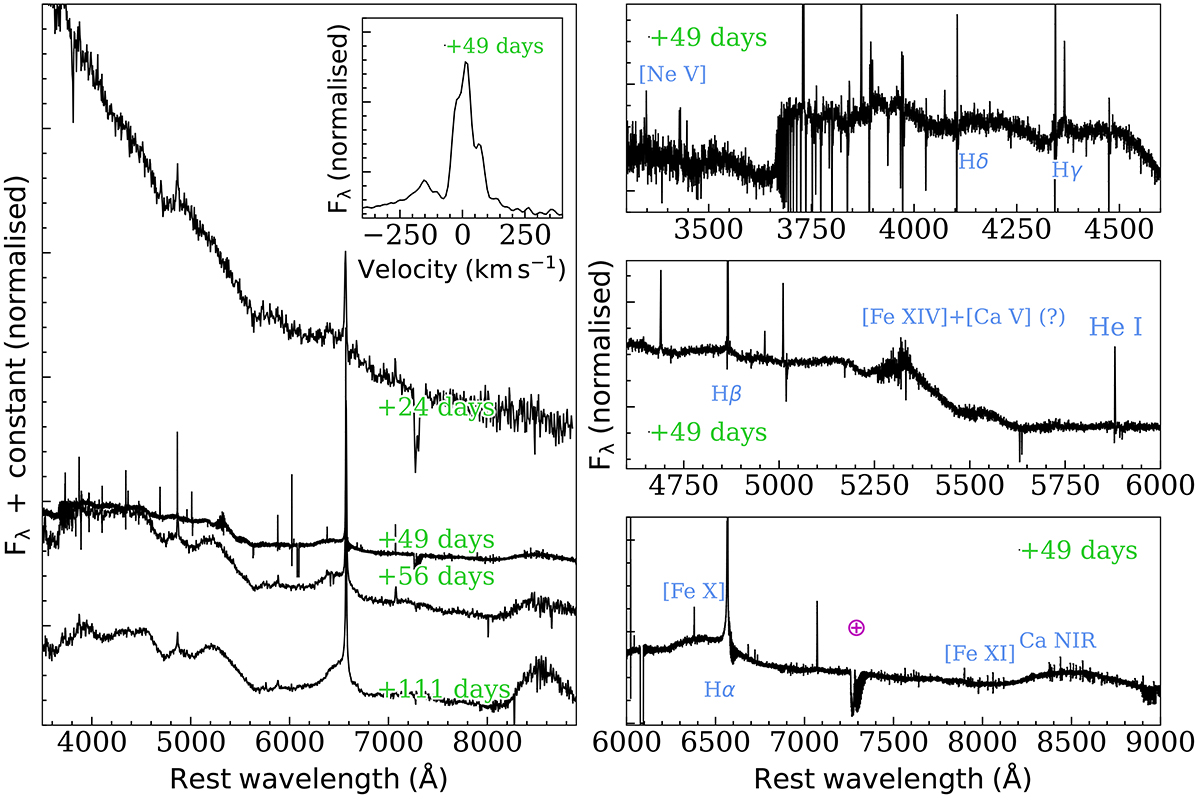
Spectral evolution of SN 2022qml as shown through the most significant spectra. Numbers close to the spectra indicate the phase from explosion corrected for time dilation. All spectra are scaled with respect to the Hα and arbitrarily shifted for better visualisation. The spectra have not been corrected for extinction. We also plot the narrow Hα in velocity space to show the P Cygni profile due to the wind that formed the CSM.
Current usage metrics show cumulative count of Article Views (full-text article views including HTML views, PDF and ePub downloads, according to the available data) and Abstracts Views on Vision4Press platform.
Data correspond to usage on the plateform after 2015. The current usage metrics is available 48-96 hours after online publication and is updated daily on week days.
Initial download of the metrics may take a while.