Open Access
Fig. 20.
Download original image
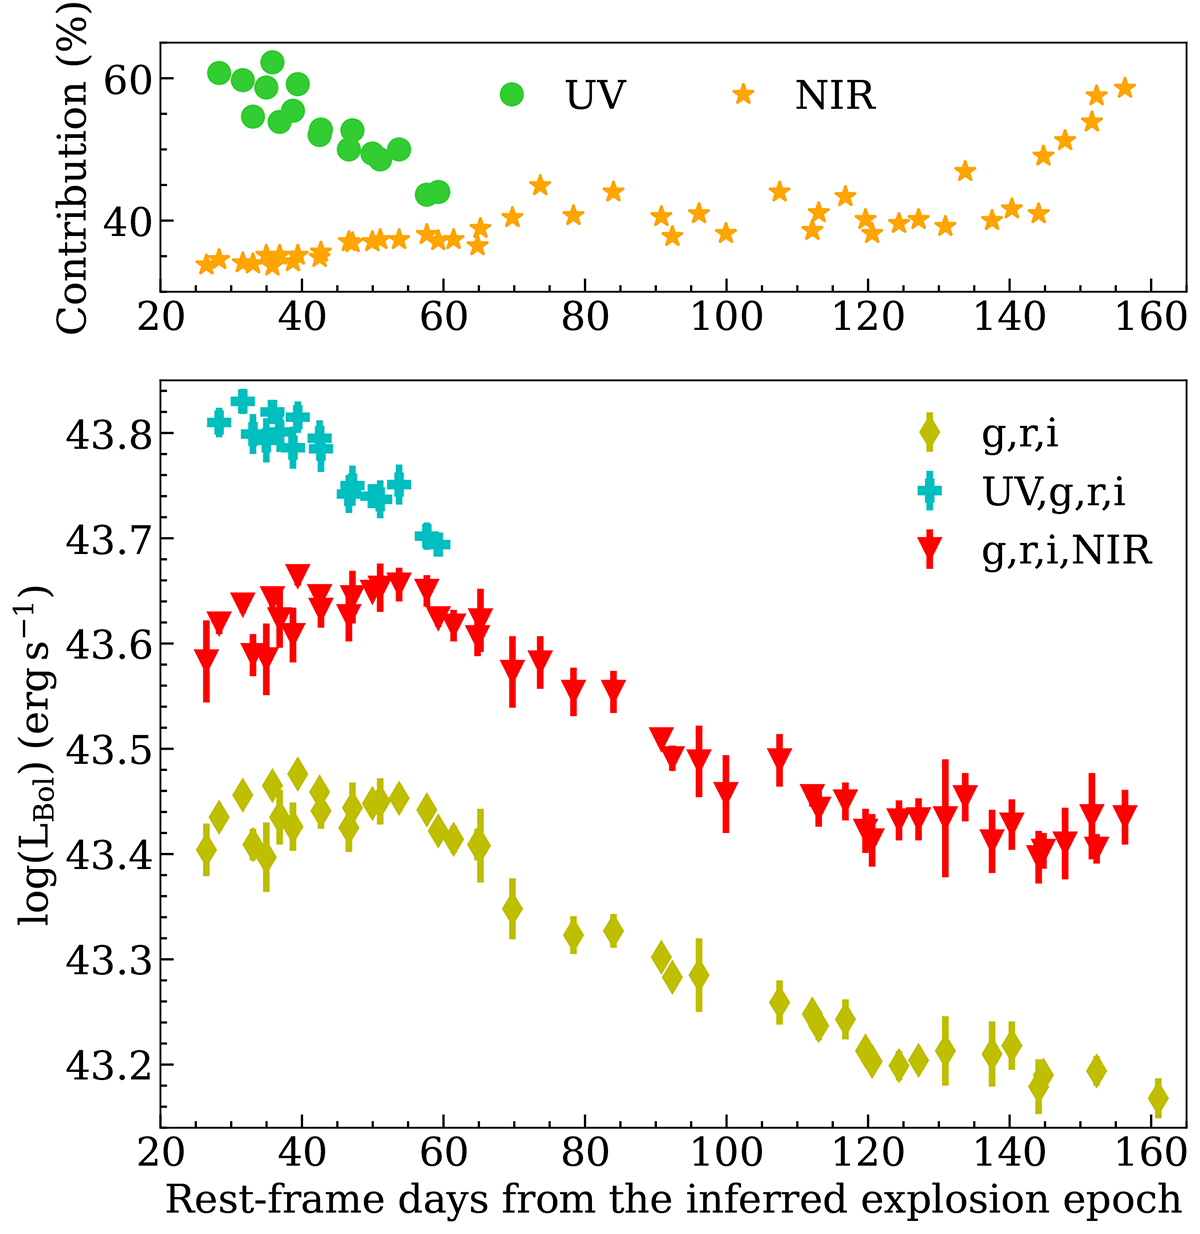
Ultraviolet and NIR contribution for SN 2021acya. The upper panel shows the differences between the luminosities computed using UV and NIR observations with respect to the bolometric light curve computed taking into consideration only optical bands.
Current usage metrics show cumulative count of Article Views (full-text article views including HTML views, PDF and ePub downloads, according to the available data) and Abstracts Views on Vision4Press platform.
Data correspond to usage on the plateform after 2015. The current usage metrics is available 48-96 hours after online publication and is updated daily on week days.
Initial download of the metrics may take a while.