Fig. 12.
Download original image
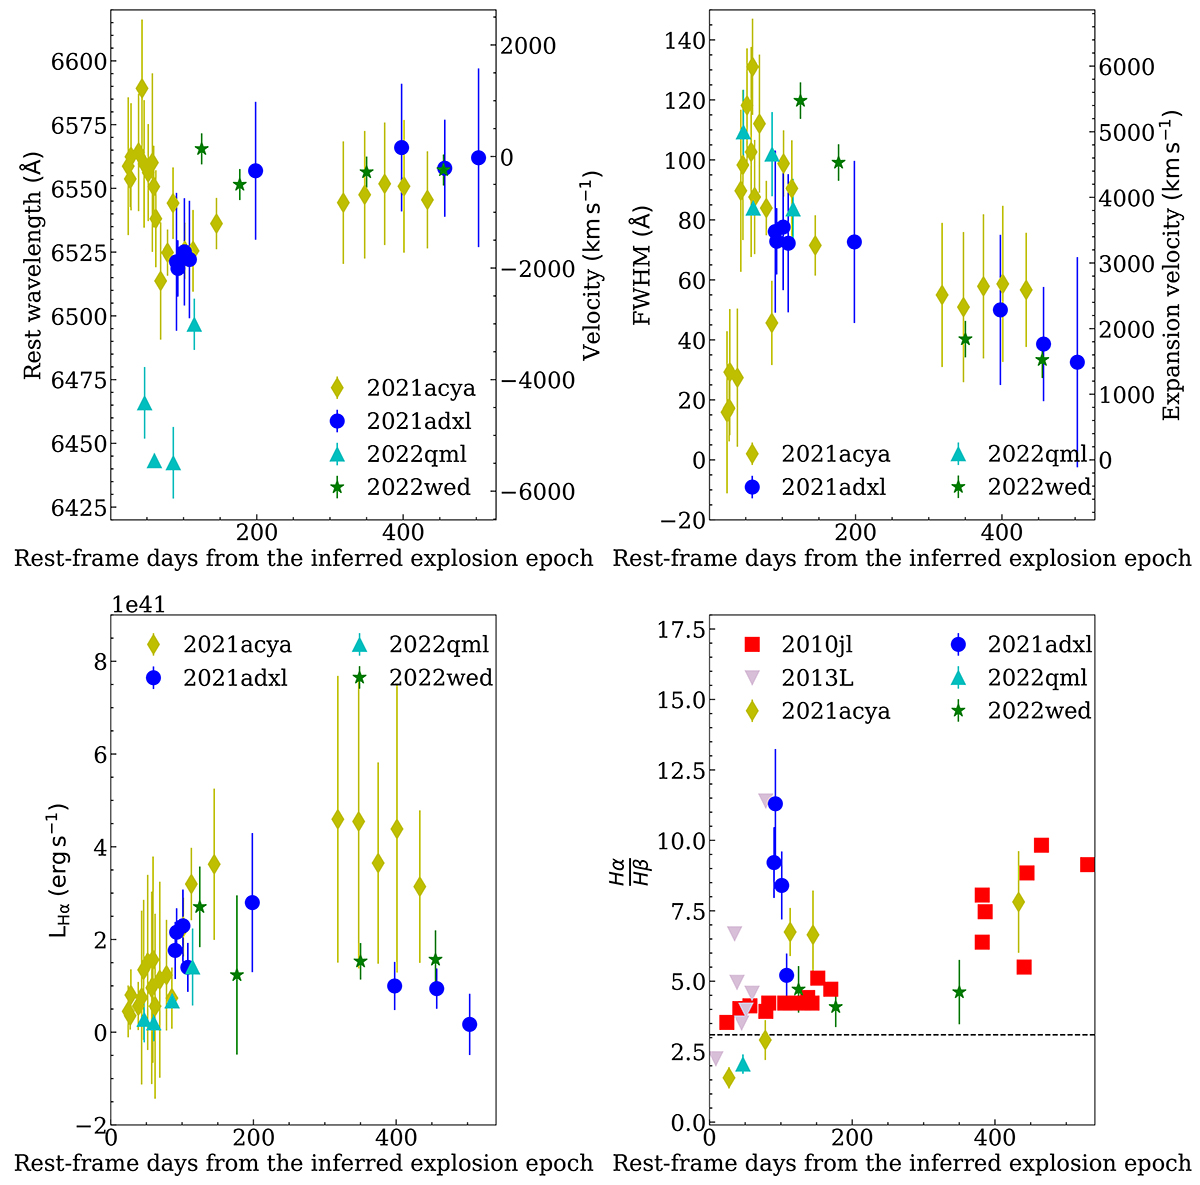
Results of the multifit on the broad Hα and Hβ for the SNe in the sample. Top left: central wavelength of the Hα line. Top right: full width half maximum of the Hα line. Bottom left: Hα luminosity. Bottom right: ratio of ![]() from the values measured for our spectra. The dashed line indicates the division between recombination and collision, which is considered to be 3.1, as in Osterbrock & Ferland (2006) (case B). Data from SN 2010jl taken from Fransson et al. (2014) and from SN 2013L taken from Taddia et al. (2020) are also added given their spectral similarity to the SNe in the sample.
from the values measured for our spectra. The dashed line indicates the division between recombination and collision, which is considered to be 3.1, as in Osterbrock & Ferland (2006) (case B). Data from SN 2010jl taken from Fransson et al. (2014) and from SN 2013L taken from Taddia et al. (2020) are also added given their spectral similarity to the SNe in the sample.
Current usage metrics show cumulative count of Article Views (full-text article views including HTML views, PDF and ePub downloads, according to the available data) and Abstracts Views on Vision4Press platform.
Data correspond to usage on the plateform after 2015. The current usage metrics is available 48-96 hours after online publication and is updated daily on week days.
Initial download of the metrics may take a while.