Fig. 8.
Download original image
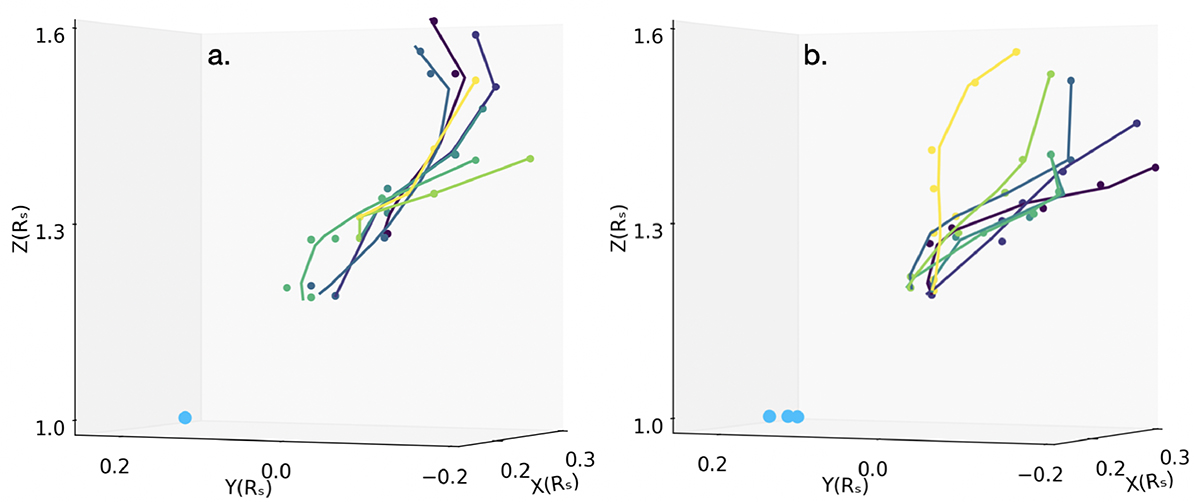
The left (a) and right panel (b) show the trajectories of the radio bursts during P2 and P3, respectively. Different colour implies different bursts and the circles imply the location of the sources. The blue circles imply the locations of the HXR sources on the XY plane, respectively. One can clearly see the topology of the trajectories is quite different between P2 and P3.
Current usage metrics show cumulative count of Article Views (full-text article views including HTML views, PDF and ePub downloads, according to the available data) and Abstracts Views on Vision4Press platform.
Data correspond to usage on the plateform after 2015. The current usage metrics is available 48-96 hours after online publication and is updated daily on week days.
Initial download of the metrics may take a while.