Fig. 7.
Download original image
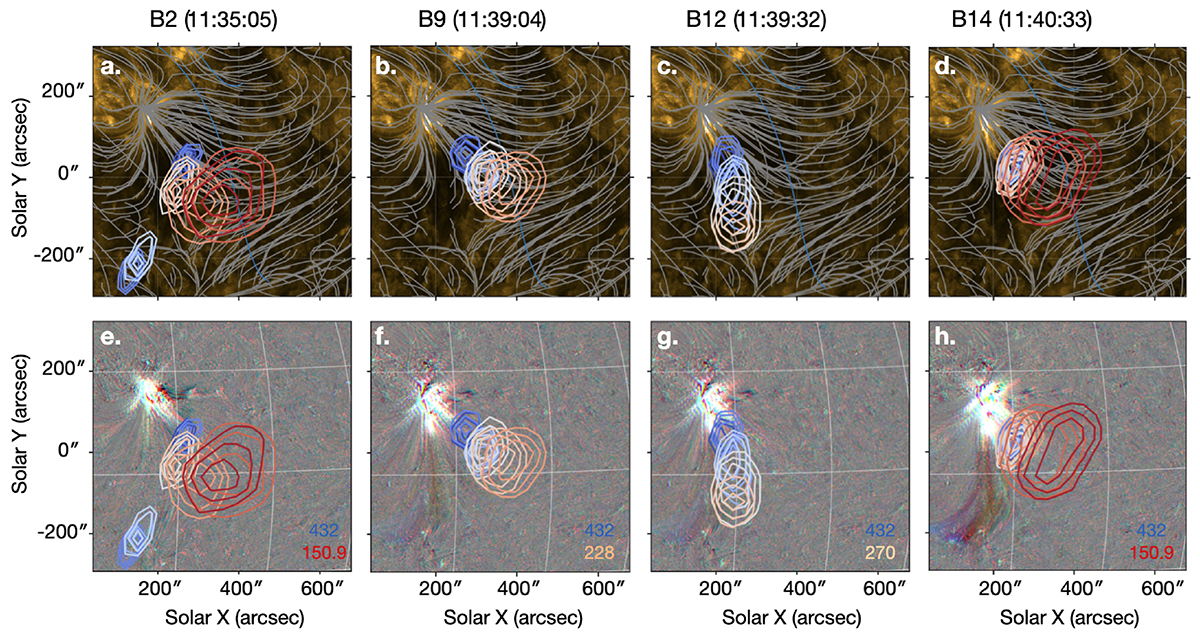
PFSS field lines are overlaid on the AIA 171 Å image with B2, B9, B12, and B14 at different times (indicated on the title) The extrapolation was done using the Global Oscillation Network Group (GONG) magnetogram synoptic map observations at 09:44 UT. In the bottom panel, we have overlaid the same radio bursts on the AIA ratio images of 211 Å, 193 Å, and 171 Å to look at the plasma outflows.
Current usage metrics show cumulative count of Article Views (full-text article views including HTML views, PDF and ePub downloads, according to the available data) and Abstracts Views on Vision4Press platform.
Data correspond to usage on the plateform after 2015. The current usage metrics is available 48-96 hours after online publication and is updated daily on week days.
Initial download of the metrics may take a while.