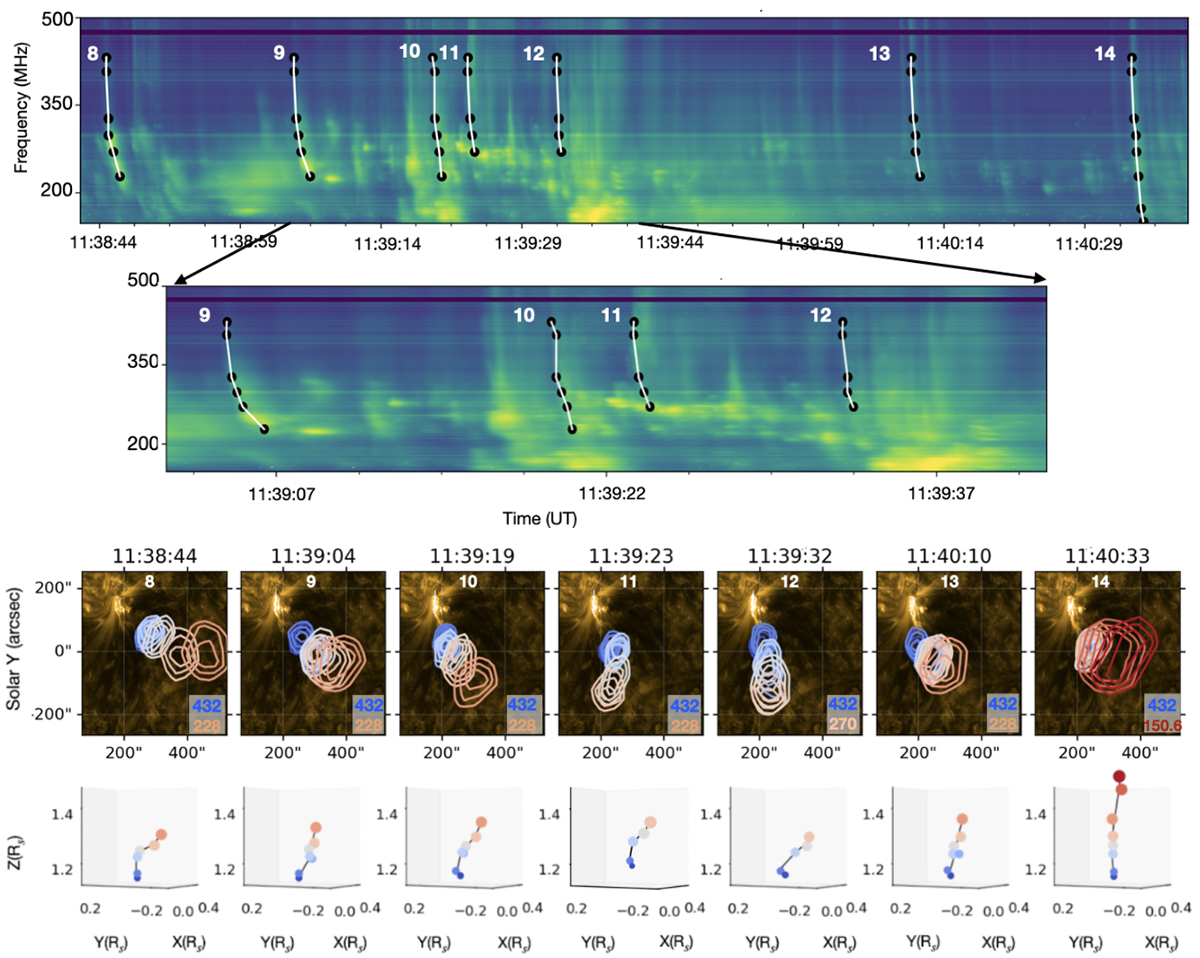
Fig. 6.
Download original image
The top panel shows the dynamic spectra from 11:38:42–11:40:38 UT. We also show the zoom-in of the spectra showing that the bursts are different than the ones during P2. Here we identify three different types of bursts: a) the type IIIs with sharp cutoff (B8 & B9), b) diffuse type IIIs (B10, B11 & B12) & individual type IIIs (B13 & B14). The third panel from the top shows the sources for each burst overplotted on AIA images. It clearly shows that the trajectory of each burst is quite different. The trajectories in 3D show that they are in general different looking than the ones in P2.
Current usage metrics show cumulative count of Article Views (full-text article views including HTML views, PDF and ePub downloads, according to the available data) and Abstracts Views on Vision4Press platform.
Data correspond to usage on the plateform after 2015. The current usage metrics is available 48-96 hours after online publication and is updated daily on week days.
Initial download of the metrics may take a while.