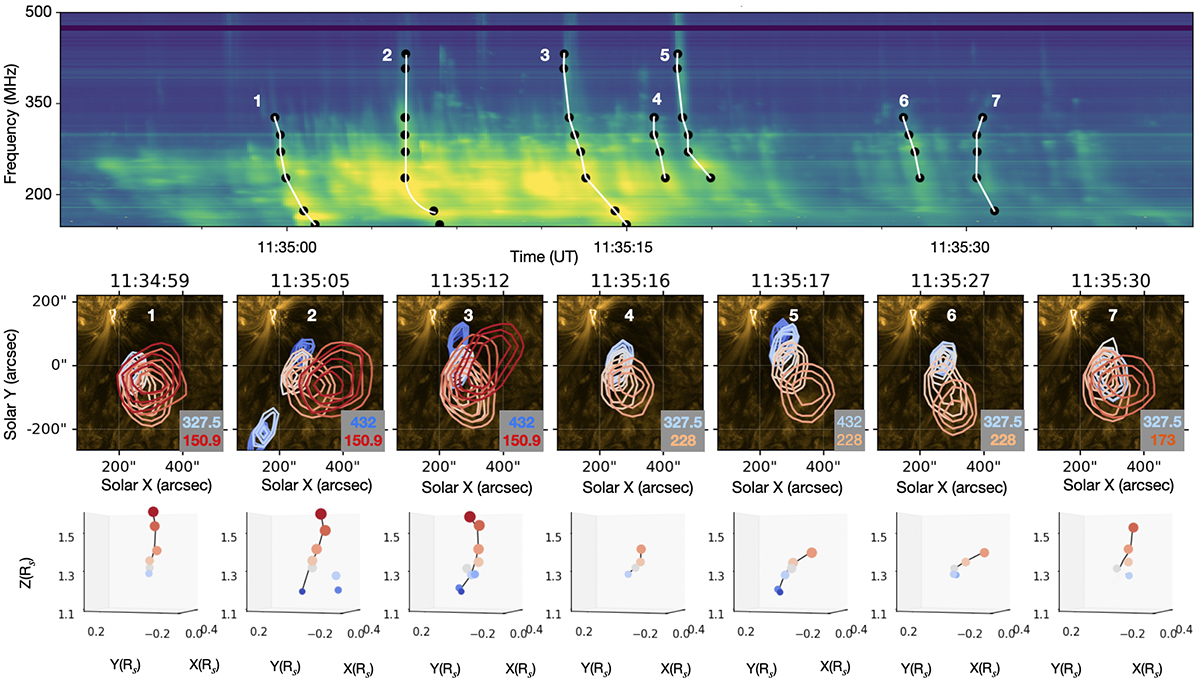
Fig. 5.
Download original image
Top panel: the dynamic spectra from 11:34:50–11:35:40 UT during P2 (2nd HXR non-thermal period). The identified bursts for imaging are indicated by the white lines on the spectra. The black dots are the frequencies and times at which NRH imaged the bursts. We identify two type Js (B2 and B5), type IIIs (B1 and B3), some narrowband emissions (B4 and B6), and one bidirectional drift burst (B7). Middle panel: shows the radio contours (85, 90, and 95% of the peak intensity) of each burst overlaid on the AIA 171 Å image. Bottom panel: the position of the centroids of each burst in 3D. Both the middle and bottom panels show that even if the source location at each frequency is different, in general the trajectories have curvature.
Current usage metrics show cumulative count of Article Views (full-text article views including HTML views, PDF and ePub downloads, according to the available data) and Abstracts Views on Vision4Press platform.
Data correspond to usage on the plateform after 2015. The current usage metrics is available 48-96 hours after online publication and is updated daily on week days.
Initial download of the metrics may take a while.