Fig. 3.
Download original image
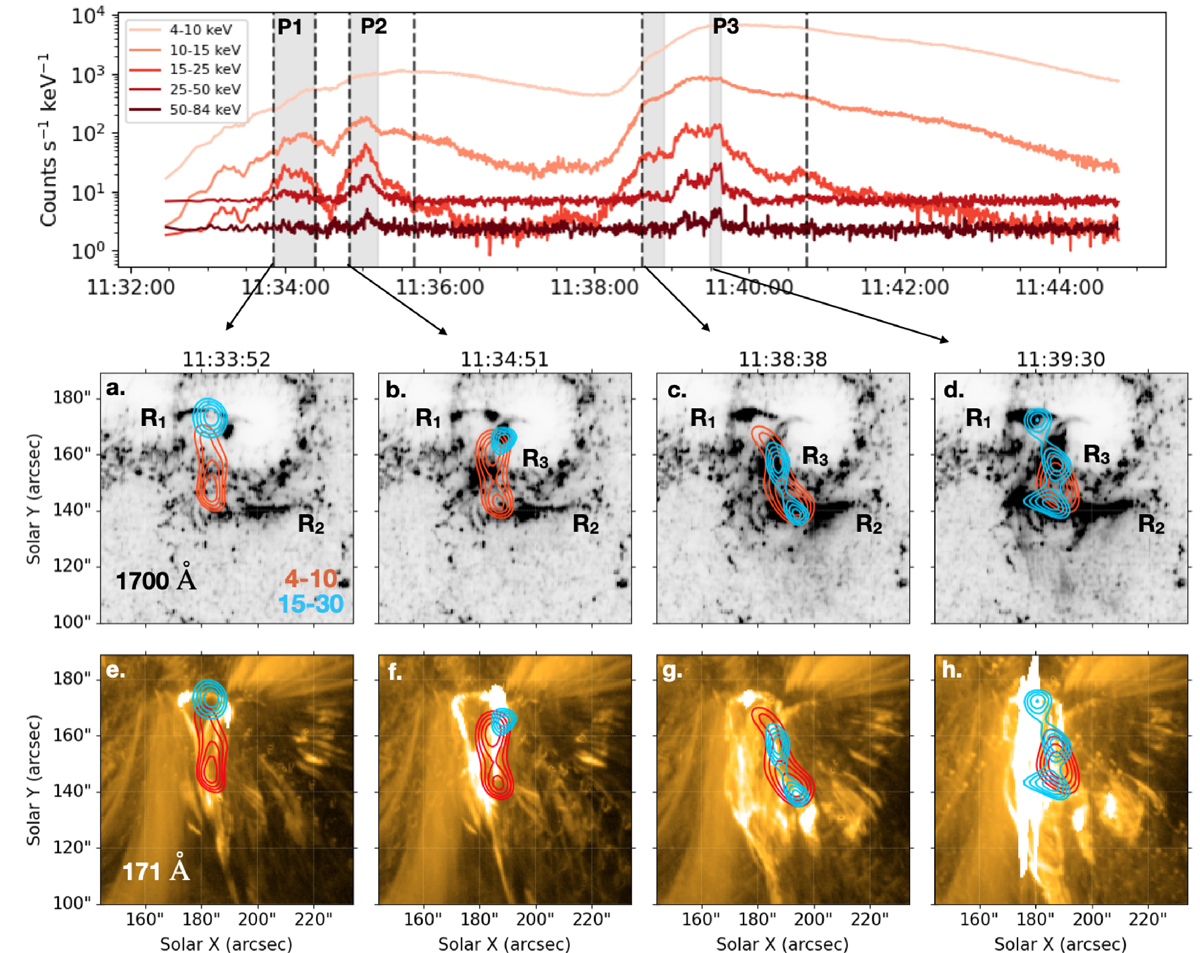
The top panel shows the STIX timeseries in five energy bands. The middle and bottom panels show the flare evolution in 1700 Å and 171 Å, respectively, during each of the non-thermal peaks. Overlaid on top of each image are the reprojected thermal (4–10 keV, red) and non-thermal (15–30 keV, sky blue) contours of the STIX images using the MEM_GE method. Panels a, b, c, and d show the appearance of one, two, or three non-thermal sources at different locations during this complex ribbon formation whereas panels e, f, g, and h show the hot loops and plasma outflows.
Current usage metrics show cumulative count of Article Views (full-text article views including HTML views, PDF and ePub downloads, according to the available data) and Abstracts Views on Vision4Press platform.
Data correspond to usage on the plateform after 2015. The current usage metrics is available 48-96 hours after online publication and is updated daily on week days.
Initial download of the metrics may take a while.