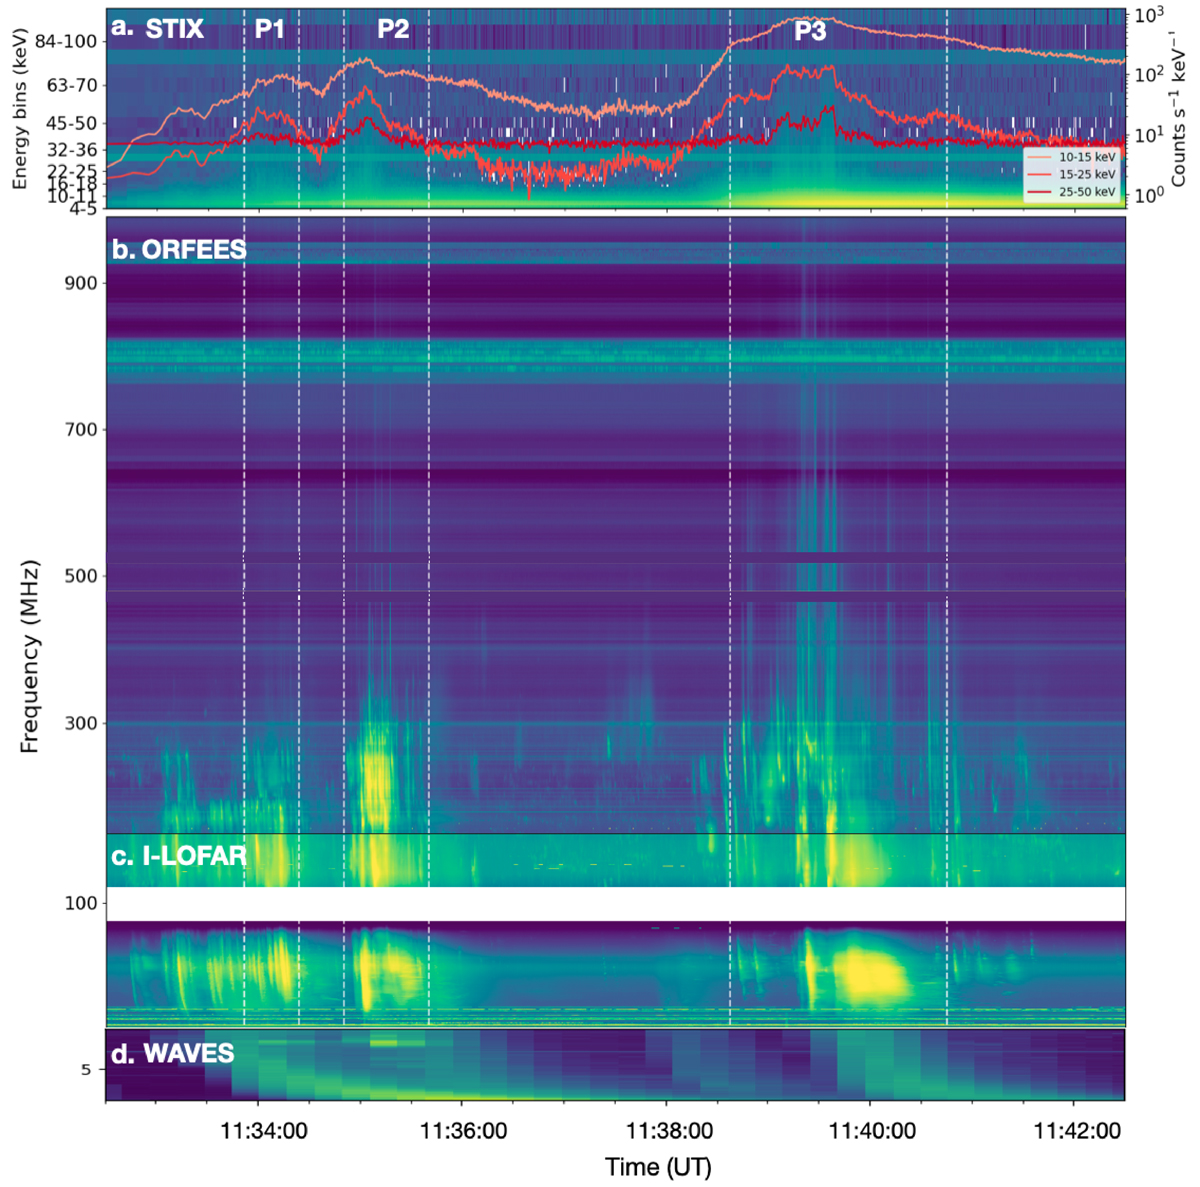
Fig. 2.
Download original image
(a) STIX X-ray spectrogram with the time series of the summed non-thermal energy bands overplotted on top of it. The plot shows the three major non-thermal periods. (b), (c), and (d) show the type III bursts observed by ORFEES, I-LOFAR, and WAVES in the frequency range from 1–1004 MHz. Clearly there is a temporal association between each individual HXR period and groups of radio bursts.
Current usage metrics show cumulative count of Article Views (full-text article views including HTML views, PDF and ePub downloads, according to the available data) and Abstracts Views on Vision4Press platform.
Data correspond to usage on the plateform after 2015. The current usage metrics is available 48-96 hours after online publication and is updated daily on week days.
Initial download of the metrics may take a while.