Fig. 7.
Download original image
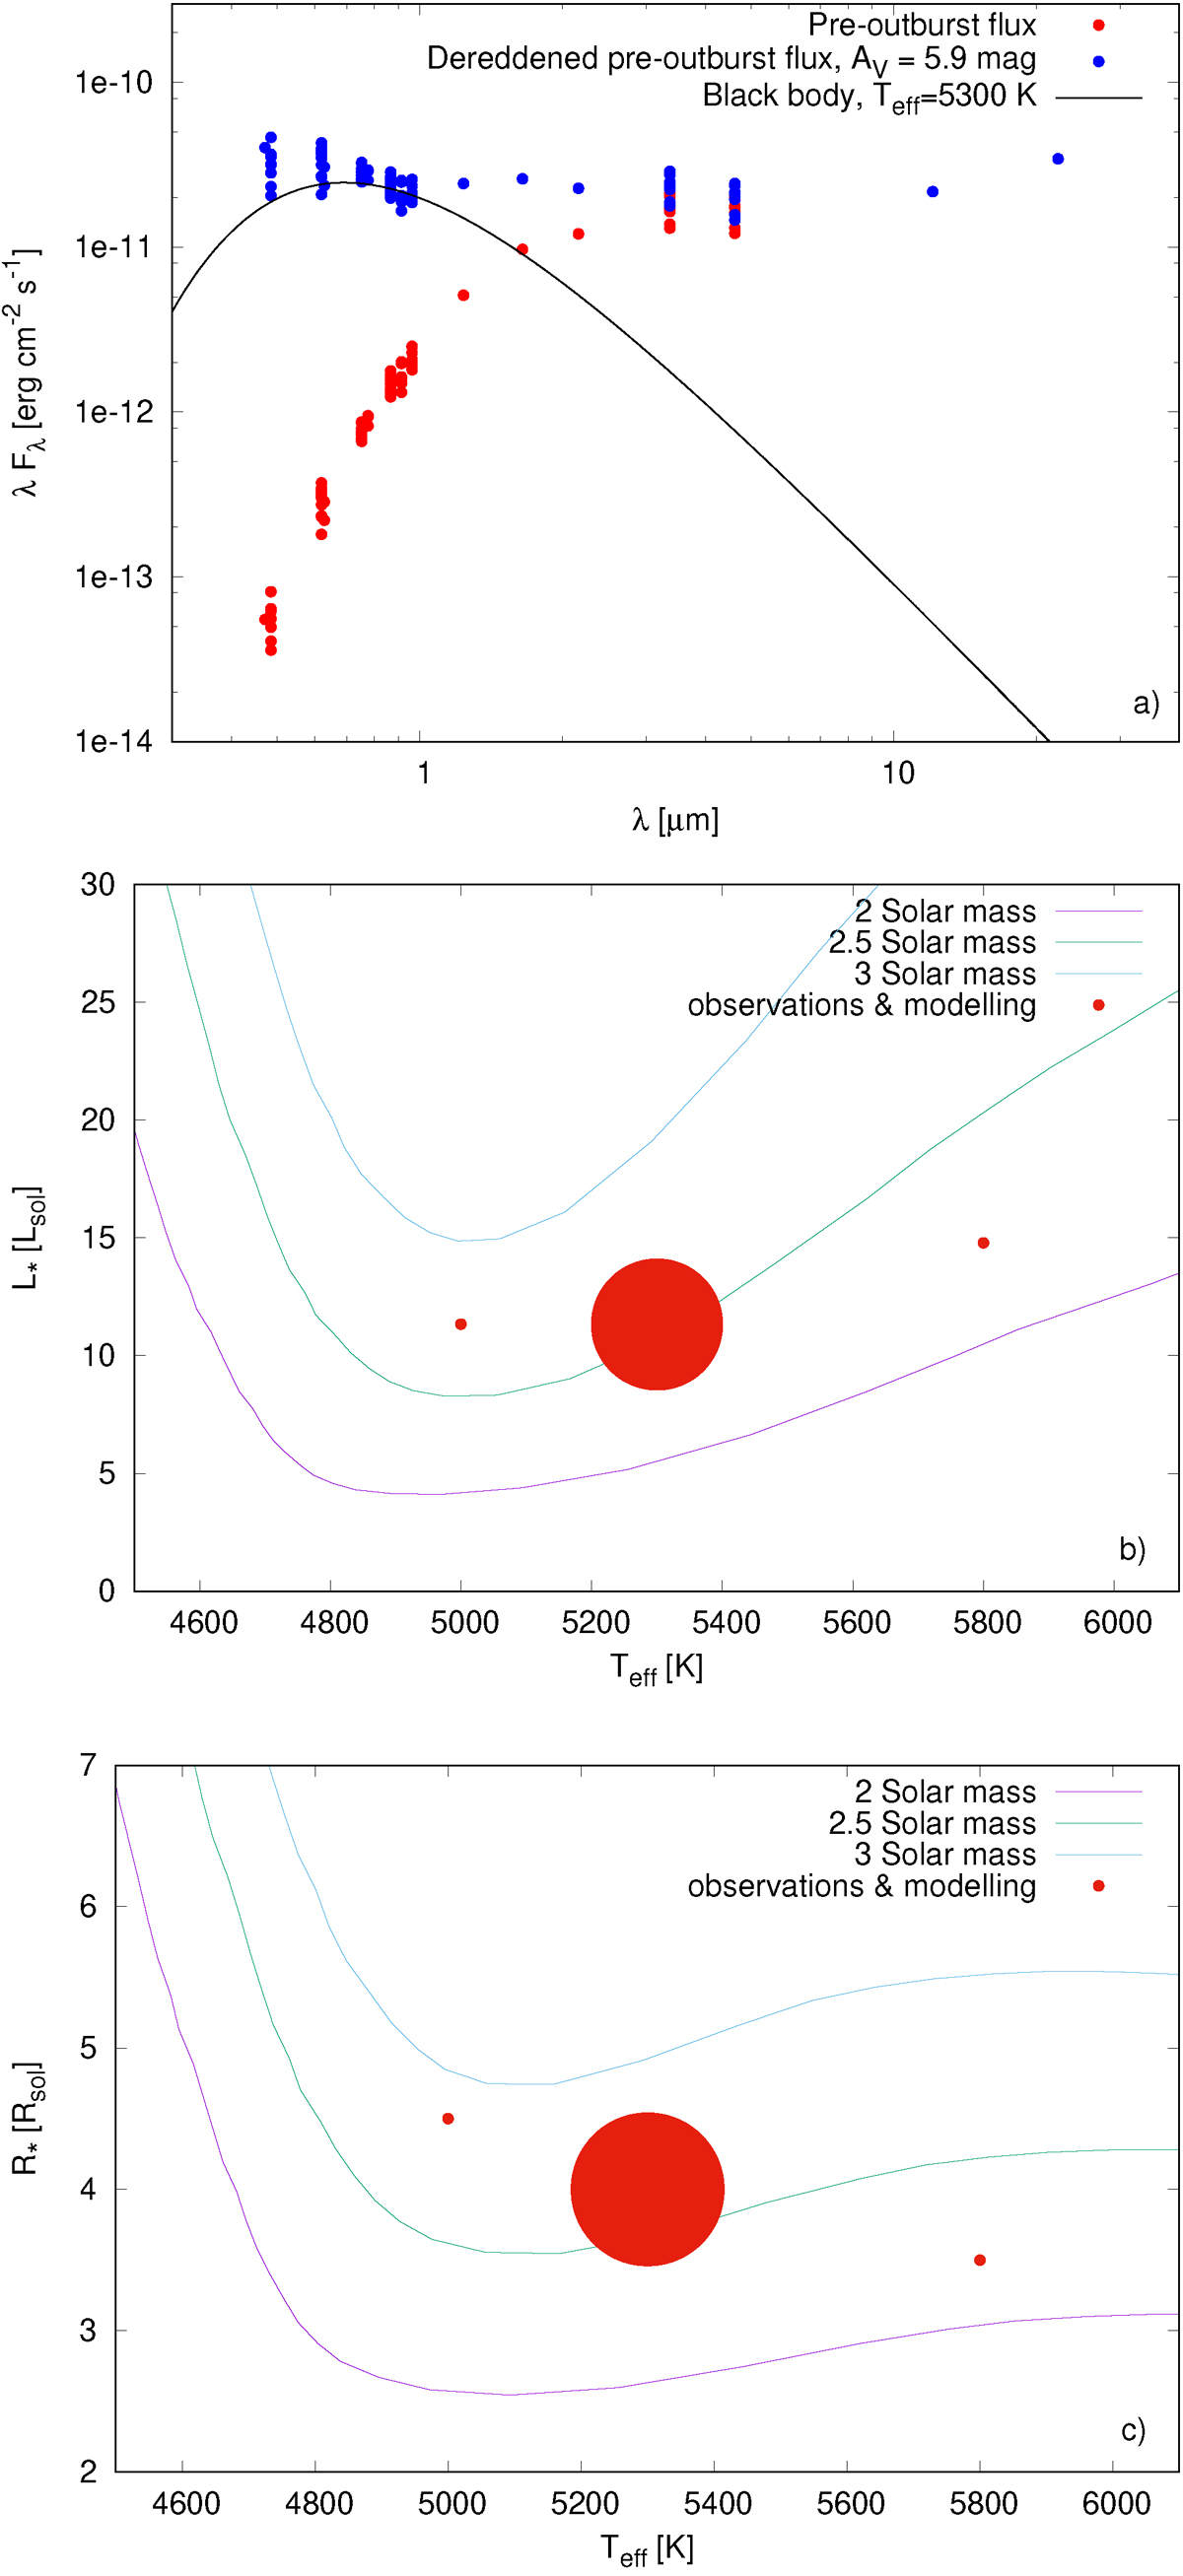
Pre-outburst SED suggesting either flat spectrum or Class I membership (panel a). The same panel shows results of the dereddened quiescent data modelling. Position of the star in the H-R diagram based on modelling results (panels b&c); the one obtained with the assumption of the optimal temperature (5300 K) and distance (3.3 kpc) is indicated by the largest dot. The size of the dot fairly well represent the uncertainty in L* and R* caused by uncertainty in distance (3.0–3.6 kpc); Similar size should be applied to the two small dots to indicate uncertainties.
Current usage metrics show cumulative count of Article Views (full-text article views including HTML views, PDF and ePub downloads, according to the available data) and Abstracts Views on Vision4Press platform.
Data correspond to usage on the plateform after 2015. The current usage metrics is available 48-96 hours after online publication and is updated daily on week days.
Initial download of the metrics may take a while.