Fig. 6.
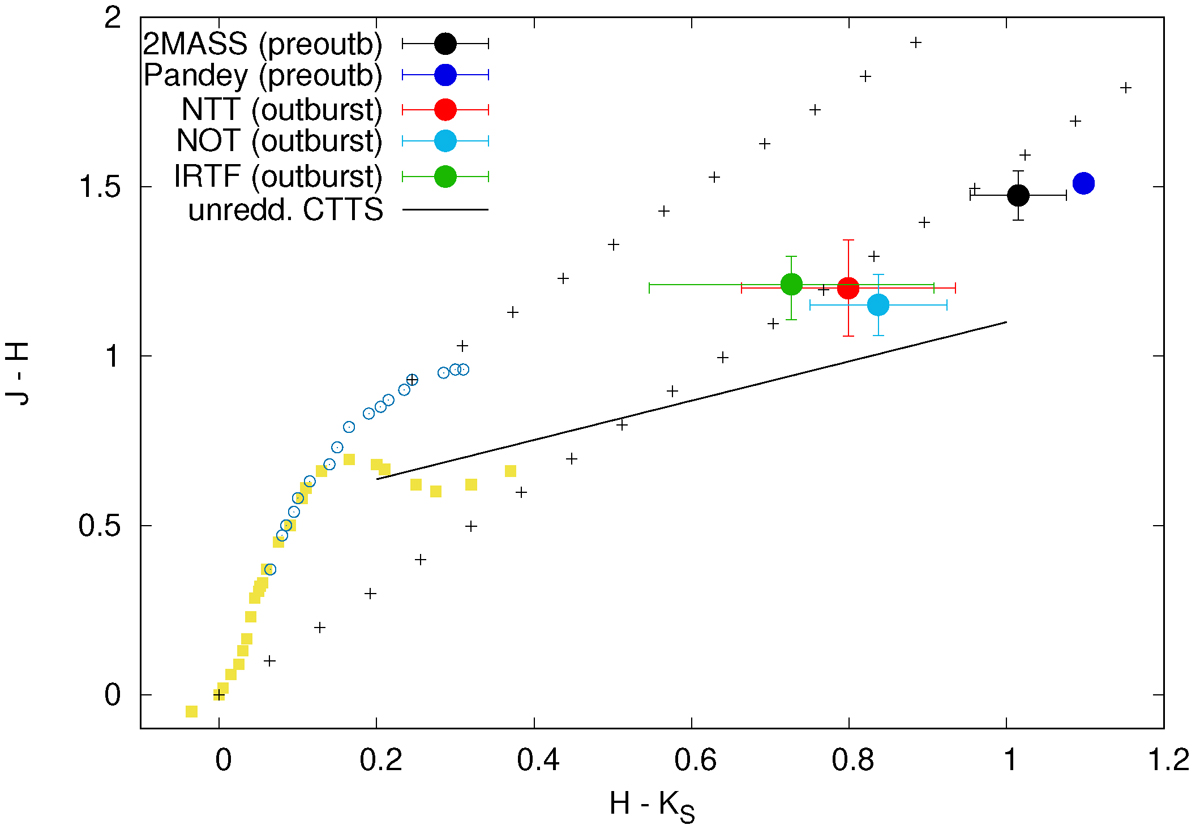
Download original image
J − H vs. H − KS colour-colour diagram prepared from pre-outburst (2MASS and Pandey et al. 2022) & outburst (SOFI, NOT, IRTF) data of Gaia20bdk. The squares represent zero age main sequence (ZAMS) stars, while the open circles show giant branch (GB) stars (Bessell & Brett 1988). The black line is the locus of unreddened CTTS (Meyer et al. 1997). The two parallel lines formed from pluses represent the reddening path; the step represents the reddening by additional 1 mag in AV.
Current usage metrics show cumulative count of Article Views (full-text article views including HTML views, PDF and ePub downloads, according to the available data) and Abstracts Views on Vision4Press platform.
Data correspond to usage on the plateform after 2015. The current usage metrics is available 48-96 hours after online publication and is updated daily on week days.
Initial download of the metrics may take a while.