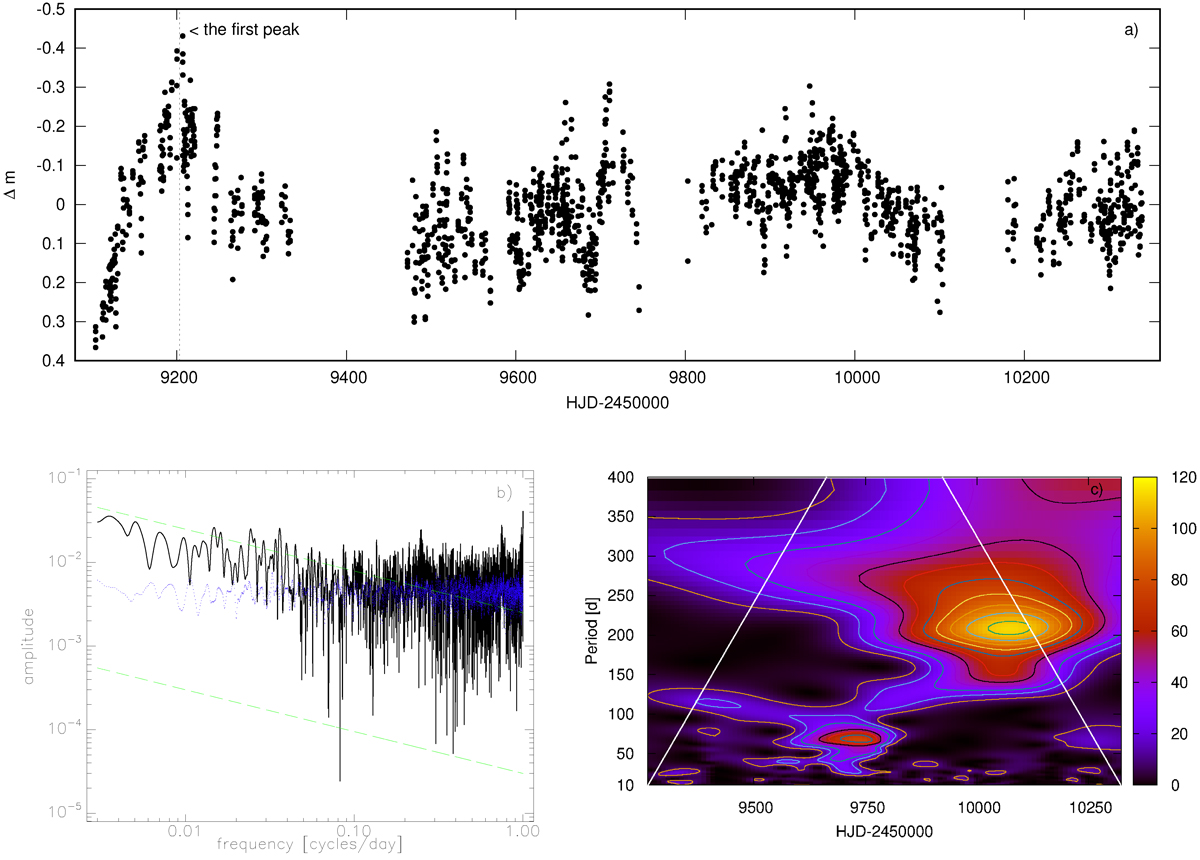
Fig. 4.
Download original image
ATLAS o-band light curve obtained during the plateau, with the slow brightening trend removed (panel a). The second panel shows Fourier spectrum (black line) in the log-log scale, calculated from the o-band data taken during the plateau and transformed to normalised flux unit. The flickering noise nature (af ∼ f−1/2) of these oscillations is indicated by the two parallel green dashed lines, while the amplitude errors are represented by blue dots. Third panel (c) shows respective WWZ spectrum. The major edge effects lie outside of the white dashed lines. The WWZ power is expressed in colours, as shown in the right label.
Current usage metrics show cumulative count of Article Views (full-text article views including HTML views, PDF and ePub downloads, according to the available data) and Abstracts Views on Vision4Press platform.
Data correspond to usage on the plateform after 2015. The current usage metrics is available 48-96 hours after online publication and is updated daily on week days.
Initial download of the metrics may take a while.