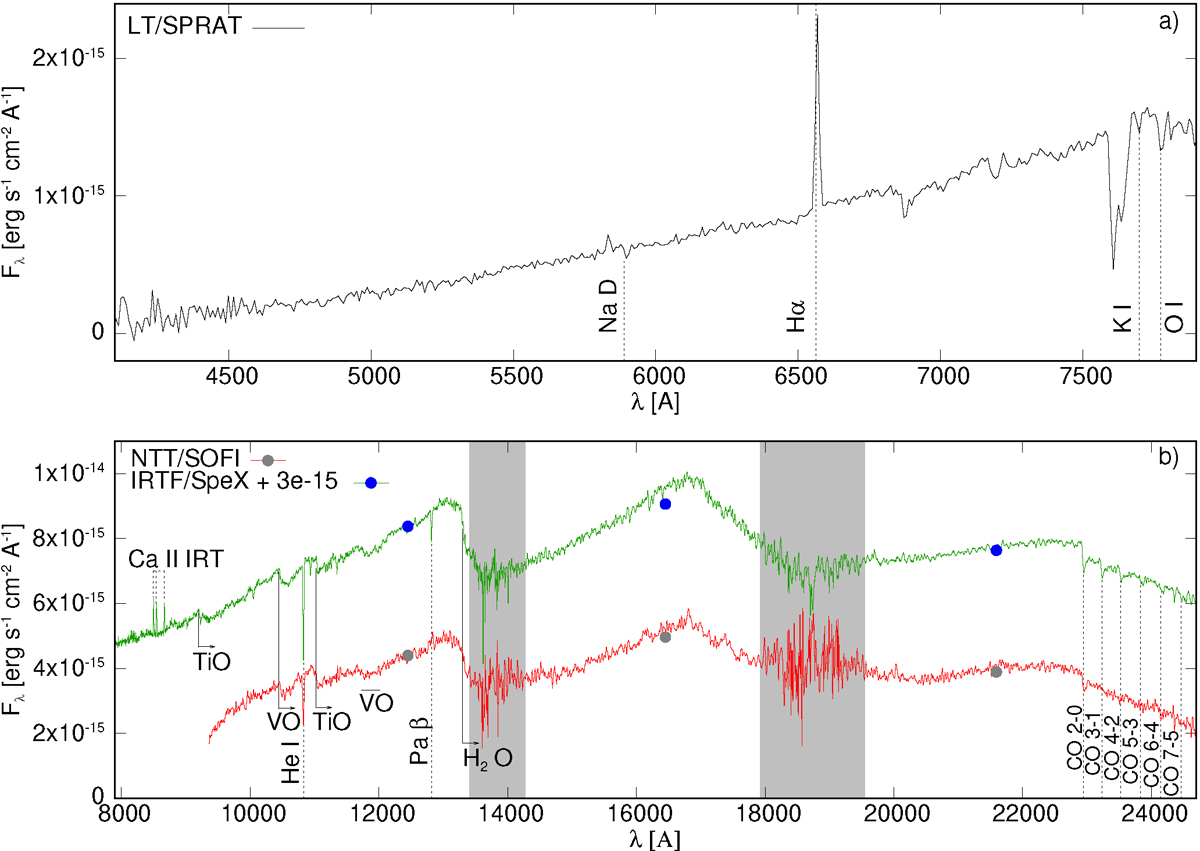
Fig. 2.
Download original image
Low-resolution LT/SPRAT spectrum (panel a), and the NTT/SOFI (2021 May 9) and the IRTF/SpeX (2023 December 3) low- and medium-resolution flux-calibrated spectra of Gaia20bdk (panel b). The grey-shaded areas in this panel demarcate regions strongly affected by telluric lines. The IRTF spectrum and photometry were shifted up by 3 × 10⁻¹⁵ erg cm−1 s−1 Å−1 for clarity. Only the major spectral lines and bands characteristic of FUors are indicated. Telluric absorption bands were not removed from the visual spectrum.
Current usage metrics show cumulative count of Article Views (full-text article views including HTML views, PDF and ePub downloads, according to the available data) and Abstracts Views on Vision4Press platform.
Data correspond to usage on the plateform after 2015. The current usage metrics is available 48-96 hours after online publication and is updated daily on week days.
Initial download of the metrics may take a while.