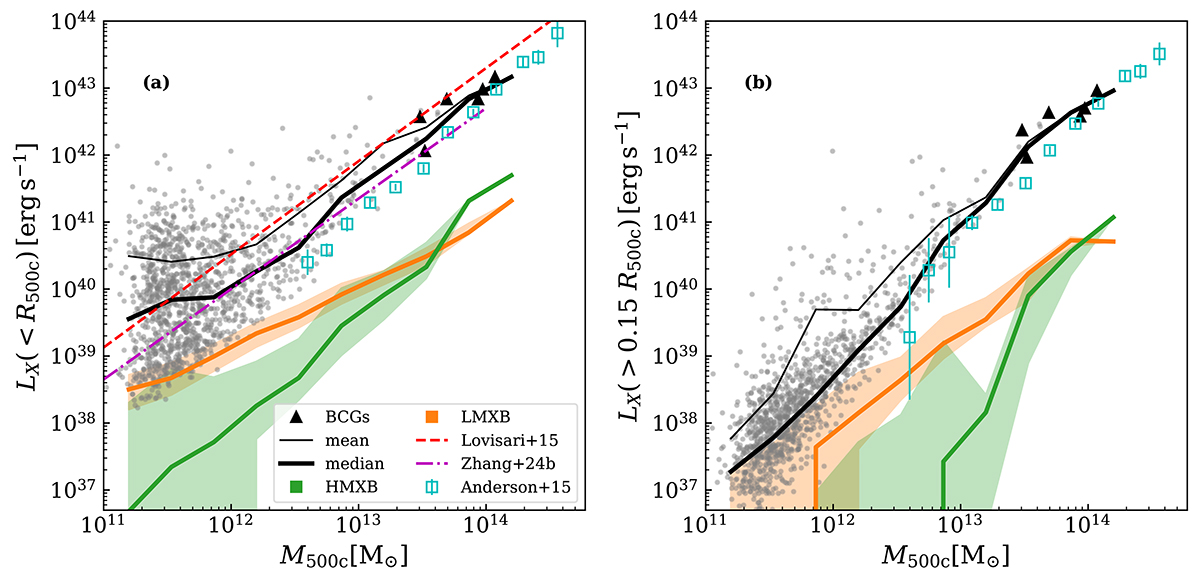
Fig. 9.
Download original image
Total X-ray luminosity as a function of halo mass (M500c) (a) within R500c of each galaxy, (b) within (0.15 − 1) R500c. Grey dots represent all galaxies in our full sample, including the AGN systems, with BCG galaxies marked as black triangles. Thin and thick lines represent the mean and median luminosity of our sample, respectively. The contribution from HMXBs and LMXBs in our sample is shown in orange and green together with the 16–84 percentile range as the shaded area. Additionally, we show data from Anderson et al. (2015) (cyan squares) for the total X-ray luminosity within R500 in (a) and CGM luminosity within 0.15 − 1 R500 in (b). The sample consists of central galaxies and results from a stacking analysis using ROSAT data. Their total mass is derived from forward modeling of the LX − M500c relation of gas-dominated halos in their sample. The magenta dash-dotted line is the best fit LX − M500c relation for stacked galaxies in eRASS:4 from Zhang et al. (2024b). The red dashed line shows the bias-corrected best fit LX − M500c relation from Lovisari et al. (2015).
Current usage metrics show cumulative count of Article Views (full-text article views including HTML views, PDF and ePub downloads, according to the available data) and Abstracts Views on Vision4Press platform.
Data correspond to usage on the plateform after 2015. The current usage metrics is available 48-96 hours after online publication and is updated daily on week days.
Initial download of the metrics may take a while.