Fig. 8.
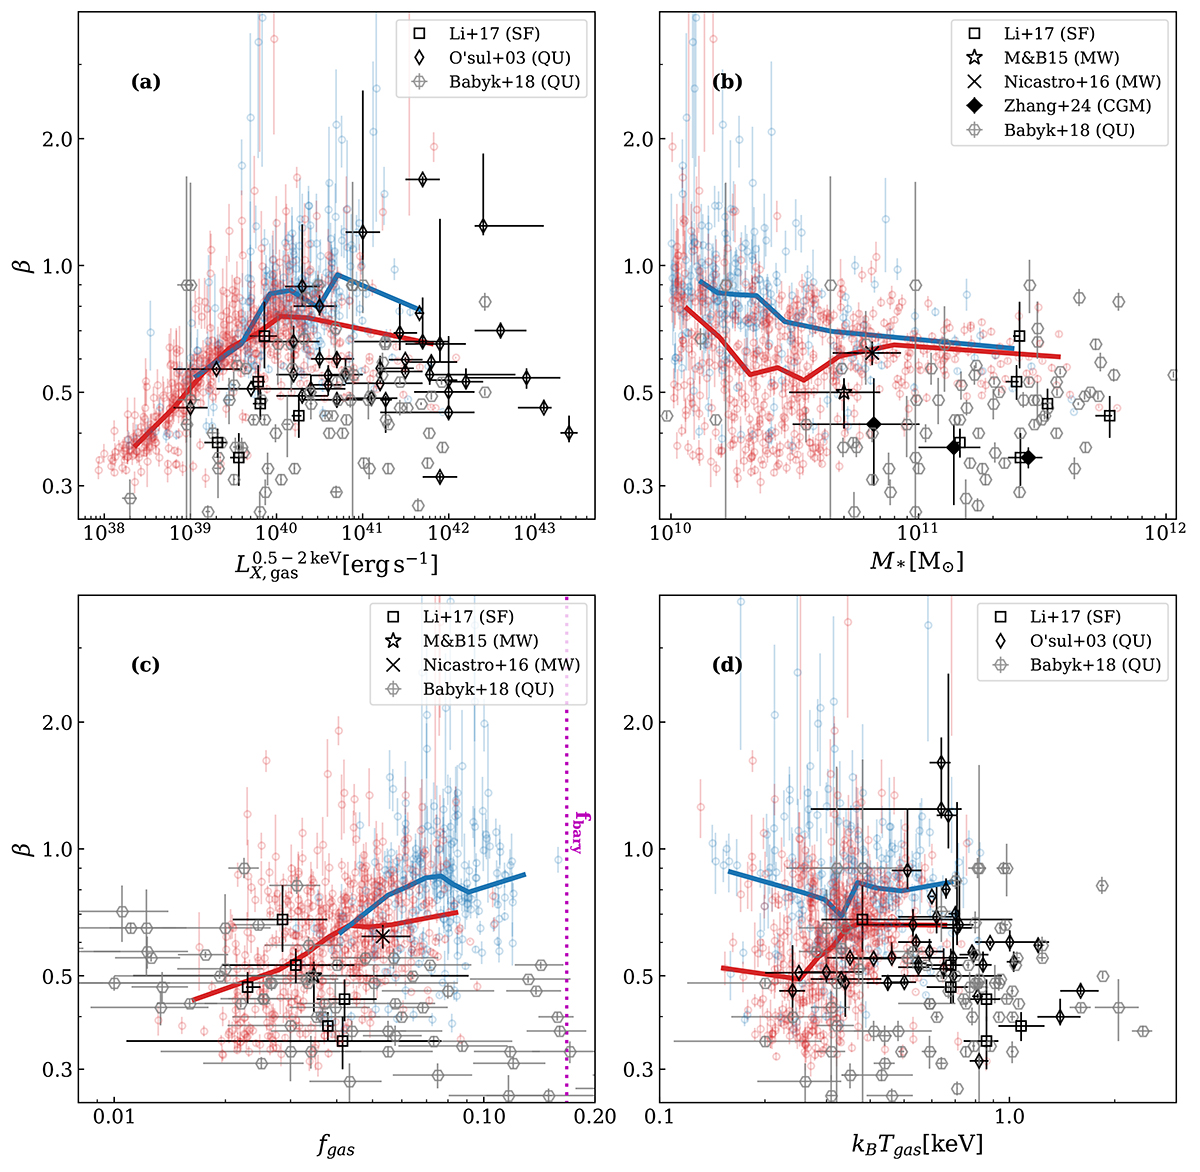
Download original image
Best-fit slope β of each galaxy’s gas SB profile labeled as a Sβ profile (Eq. (9)) against various halo properties within Rvir: (a) gas luminosity LX, gas; (b) stellar mass M* obtained from stellar resolution elements bound to the parent halo; (c) gas fraction fgas derived from gas resolution elements bound to the parent halo excluding star-forming and low-temperature (< 105 K) gas. In panel (c) the dotted magenta line indicates the cosmic baryon fraction in the simulation; (d) emissivity weighted hot gas temperature Tgas. The exact retrieval of these quantities is outlined in Section 4. The thick solid line in each panel indicates the median value of β. For comparison, we include the sample of massive elliptical galaxies from O’Sullivan et al. (2003) (O’sul+03) and massive star-forming galaxies of Li et al. (2017). Additionally, we compare to β models of the MW from Miller & Bregman (2015) (M&B15) and Nicastro et al. (2016) (model A) in (b) and (c).
Current usage metrics show cumulative count of Article Views (full-text article views including HTML views, PDF and ePub downloads, according to the available data) and Abstracts Views on Vision4Press platform.
Data correspond to usage on the plateform after 2015. The current usage metrics is available 48-96 hours after online publication and is updated daily on week days.
Initial download of the metrics may take a while.