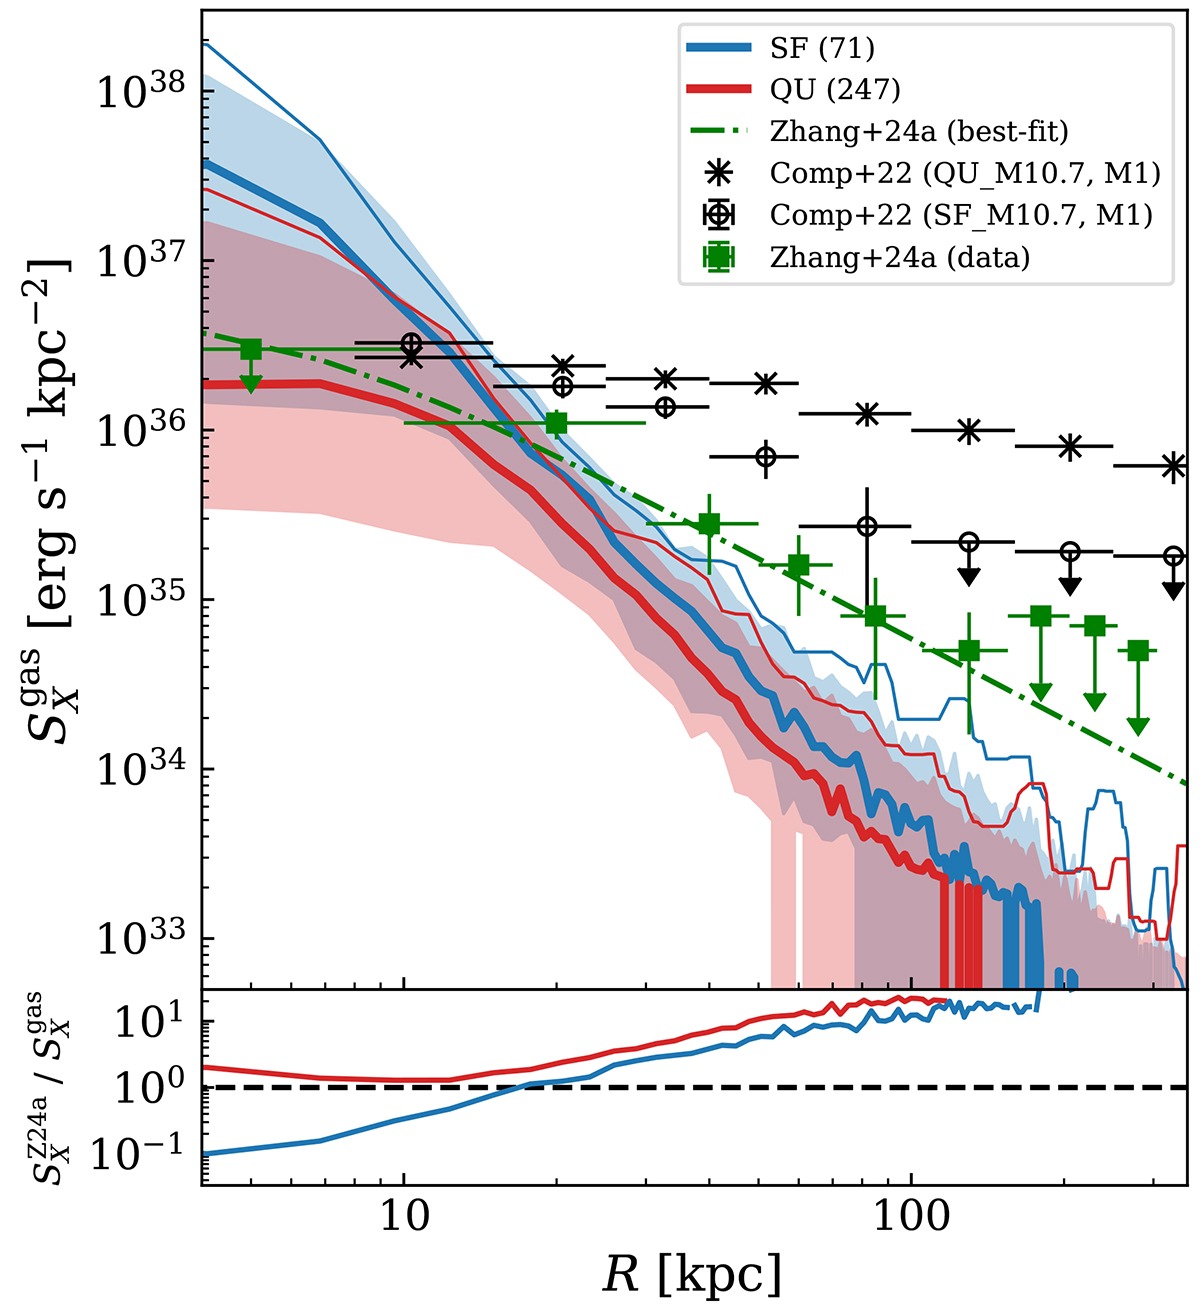
Fig. 6.
Download original image
Top: X-ray SB profile of the hot gas component recreating the mass cuts from Comparat et al. (2022). We recreate the observational sample from eFEDs galaxies (Comparat et al. 2022) by replicating their M1 mask for the SF_M10.7 and QU_M10.7 mass bins and show their background-subtracted results. Thin and thick solid-colored lines are the mean and median SB profiles of our sample of galaxies. We apply mass cuts on our sample ranging from M∗ = 1010.46−11 M⊙ for QU galaxies and M∗ = 1010.48−11 M⊙ for SF galaxies and report the total number of galaxies in each stack in the legend. We apply a median filter on the mean stacked profiles (thin solid) to remove substructures. Additionally, we show the best-fit SB profile for the CGM of MW-mass galaxies from Zhang et al. (2024a) which probes a similar stellar mass range. Bottom: ratio of the median stacked profiles (thick, upper panel) of the SF and QU mass-matched sample with the best-fit beta model for MW-mass galaxies from Zhang et al. (2024a).
Current usage metrics show cumulative count of Article Views (full-text article views including HTML views, PDF and ePub downloads, according to the available data) and Abstracts Views on Vision4Press platform.
Data correspond to usage on the plateform after 2015. The current usage metrics is available 48-96 hours after online publication and is updated daily on week days.
Initial download of the metrics may take a while.