Fig. 5.
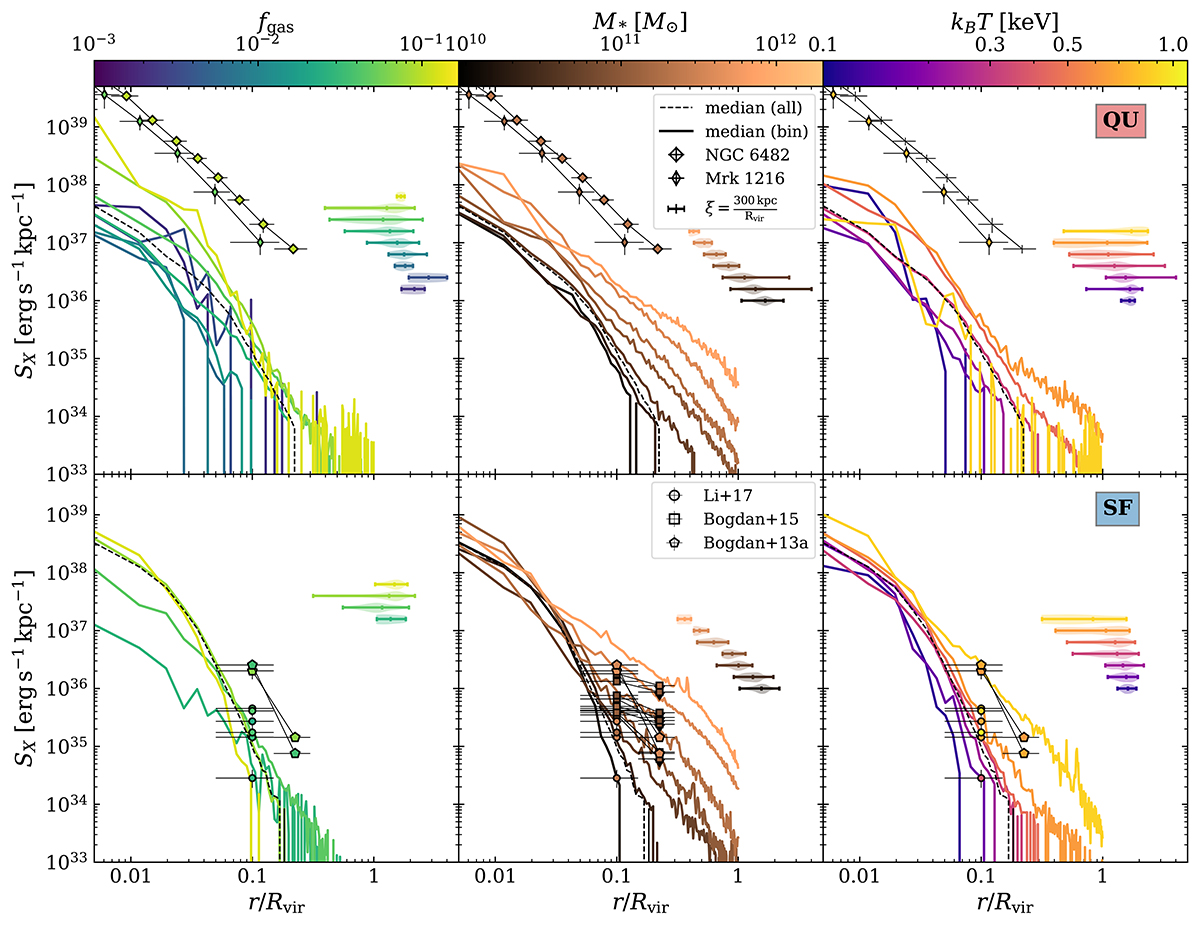
Download original image
Scale-free median SB profiles of quiescent (top) and star-forming (bottom) galaxies. Galaxies are binned by gas fraction fgas (left), stellar mass M* (center), and emissivity weighted temperature kBT (right). Colors indicate the central value of each bin for the respective quantity. We include SB profiles for NGC 6482 (Buote 2017) and Mrk 1216 (Buote & Barth 2018) in the QU panels and measurements of the extended emission in SF galaxies from Bogdán et al. (2013, 2015), Li et al. (2017) for the SF panels. The violin plots indicate the distribution of ξ (Eq. (8)) within each quantity bin. The horizontal extent of each violin indicates the minimum and maximum value of ξ within the respective bin. The central tick indicates the mean value of ξ. The height of each violin is proportional to the number density of ξ in the bin. The black dashed line is the median profile of the QU and SF sub-sample respectively.
Current usage metrics show cumulative count of Article Views (full-text article views including HTML views, PDF and ePub downloads, according to the available data) and Abstracts Views on Vision4Press platform.
Data correspond to usage on the plateform after 2015. The current usage metrics is available 48-96 hours after online publication and is updated daily on week days.
Initial download of the metrics may take a while.