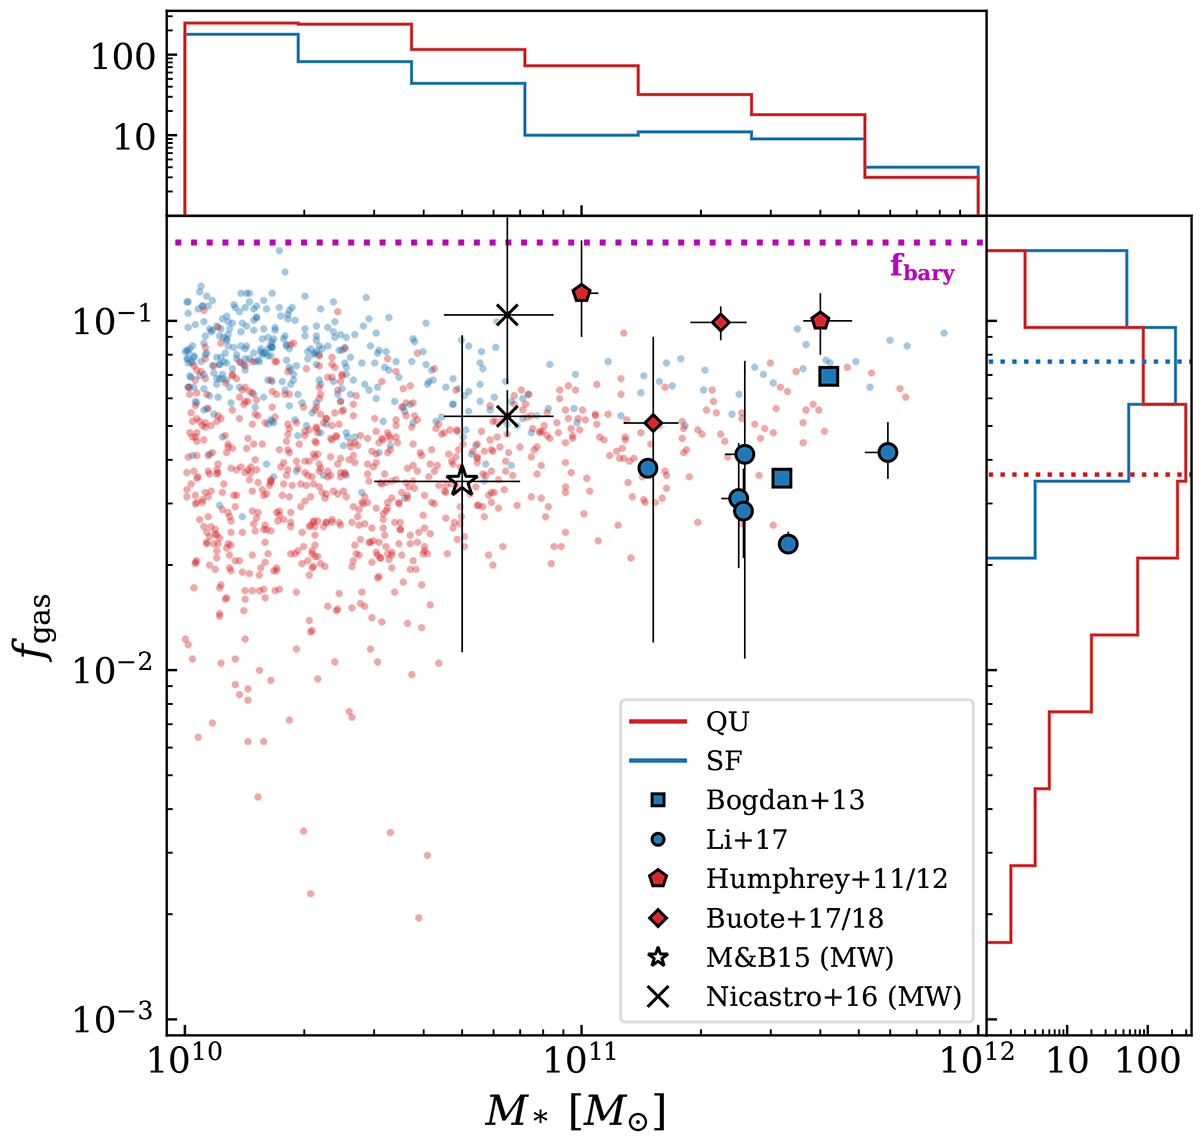
Fig. 4.
Download original image
Gas fraction against the stellar mass of central galaxy from our sample with fgas computed according to Eq. (7). SF and QU galaxies are shown in blue and red respectively. Additional symbols with error bars represent values obtained from the literature for comparison. The face color of each symbol indicates SF / QU classification. The magenta line corresponds to the cosmic baryon fraction fbary = 0.167 adopted in the simulation.
Current usage metrics show cumulative count of Article Views (full-text article views including HTML views, PDF and ePub downloads, according to the available data) and Abstracts Views on Vision4Press platform.
Data correspond to usage on the plateform after 2015. The current usage metrics is available 48-96 hours after online publication and is updated daily on week days.
Initial download of the metrics may take a while.