Fig. 3.
Download original image
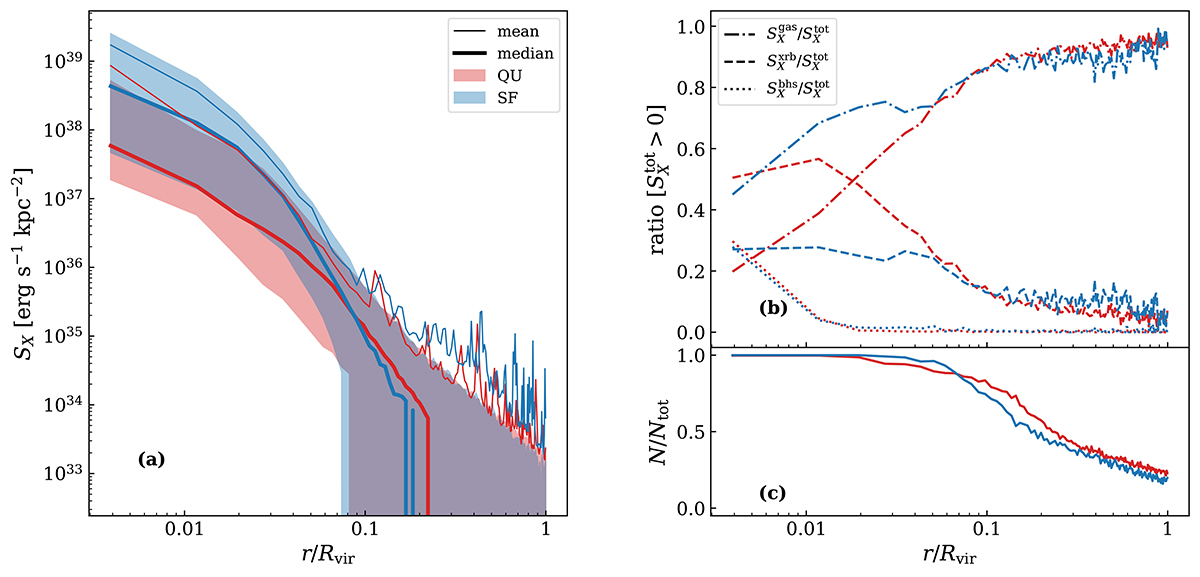
(a): average SB profiles (blue for SF, red for QU) of the normal galaxy sample in the 0.5–2 keV energy band. Thin solid lines indicate the mean total SB. Thick lines indicate the median total SB. The shaded area around the thick lines corresponds to the 16–84 percentile ranges. (b): mean ratio of the SB profiles of one component (gas: dash-dotted; XRB: dashed; SMBH: dotted) towards the total SB. At each radius, we determine the ratio between the SB of one component and the total SB for every galaxy. We take the mean of that ratio by only accounting for galaxies with non-zero SB. (c): sample completeness of the mean ratio in (b). Lines indicate the fraction of galaxies that have non-zero SB at a given radius and thus contribute to the mean ratio in (b).
Current usage metrics show cumulative count of Article Views (full-text article views including HTML views, PDF and ePub downloads, according to the available data) and Abstracts Views on Vision4Press platform.
Data correspond to usage on the plateform after 2015. The current usage metrics is available 48-96 hours after online publication and is updated daily on week days.
Initial download of the metrics may take a while.