Fig. 3
Download original image
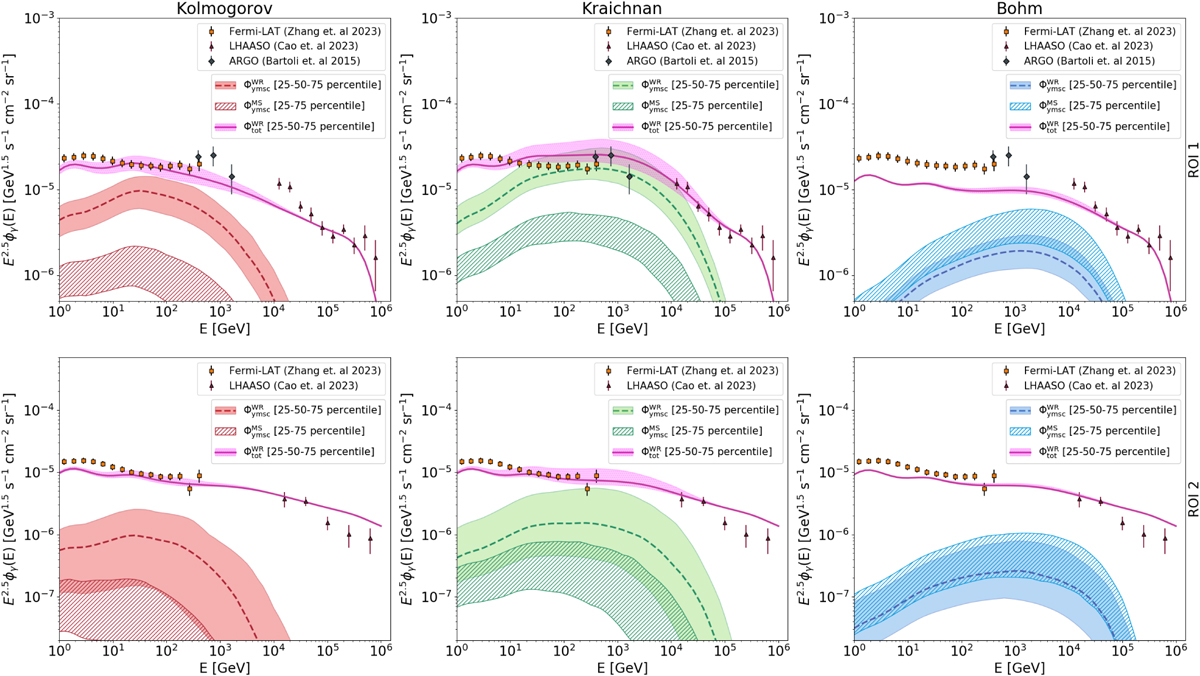
Contribution to the diffuse γ-ray emission from a synthetic population of YMSCs in ROI1 (top row) and ROI2 (bottom row) for the three different cases of the diffusion coefficient considered: Kolmogorov (left column), Kraichnan (central column) and Bohm-like (right column). The spectrum is calculated after applying the mask 𝒜 ∪ ℬ. In each plot, the dashed line represents the median flux per energy bin after considering 100 different realisations of the Milky Way population of YMSCs, while the associated shaded region encloses the 25–75 percentile flux. The striped region instead encompasses the 25–75 percentile flux when WR stars are not included in the stellar mock populations. The violet solid lines in the right column and their associated shaded regions show the median and the 25–75 percentile diffuse γ-ray flux after the addition of emission from the CR sea.
Current usage metrics show cumulative count of Article Views (full-text article views including HTML views, PDF and ePub downloads, according to the available data) and Abstracts Views on Vision4Press platform.
Data correspond to usage on the plateform after 2015. The current usage metrics is available 48-96 hours after online publication and is updated daily on week days.
Initial download of the metrics may take a while.