Fig. 2
Download original image
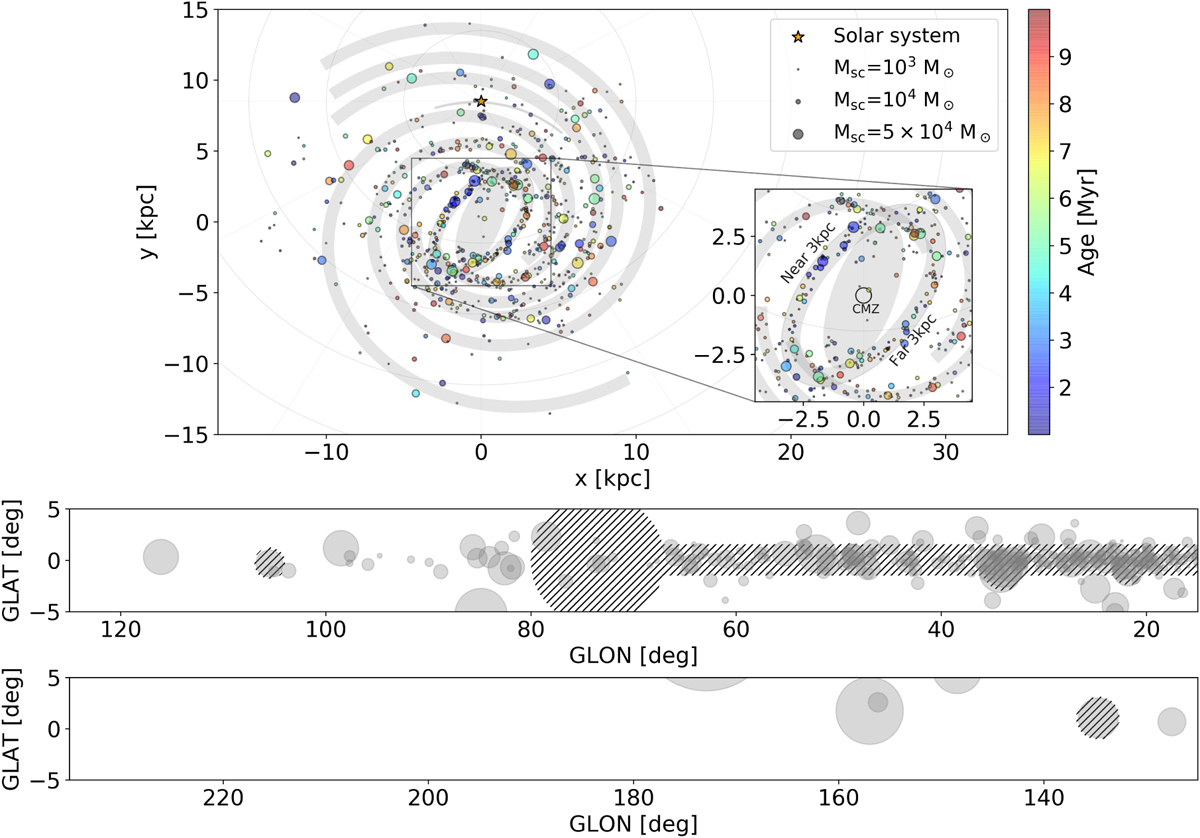
Single realization of the Milky Way population of YMSCs. Top panel: face-on view of the Milky Way. The size and colour of each YMSC refer to its mass and age respectively, according to the scales indicated in the panel. Notice that the size distribution is continuous and the associations between mass and size reported in the panel are only for reference. The grey regions represents all the Galactic structures (spiral arms, Local Spur and Galactic bar) employed in the simulation of the Milky Way cluster population. The inset shows a zoomed view of the Milky Way center. The location of the Central Molecular Zone (CMZ) is also reported for reference. The star marks the position of the Solar System. Middle and bottom panels: edge on view of the Milky Way towards ROI1 (upper panel) and ROI2 (lower panel). Grey circles represent the projected sizes of the wind-blown bubbles surrounding YMSCs. The striped regions correspond to the 𝒜 ∪ ℬ masks employed in our analysis for this specific realization of the Milky Way (see Appendix B).
Current usage metrics show cumulative count of Article Views (full-text article views including HTML views, PDF and ePub downloads, according to the available data) and Abstracts Views on Vision4Press platform.
Data correspond to usage on the plateform after 2015. The current usage metrics is available 48-96 hours after online publication and is updated daily on week days.
Initial download of the metrics may take a while.