Fig. 1
Download original image
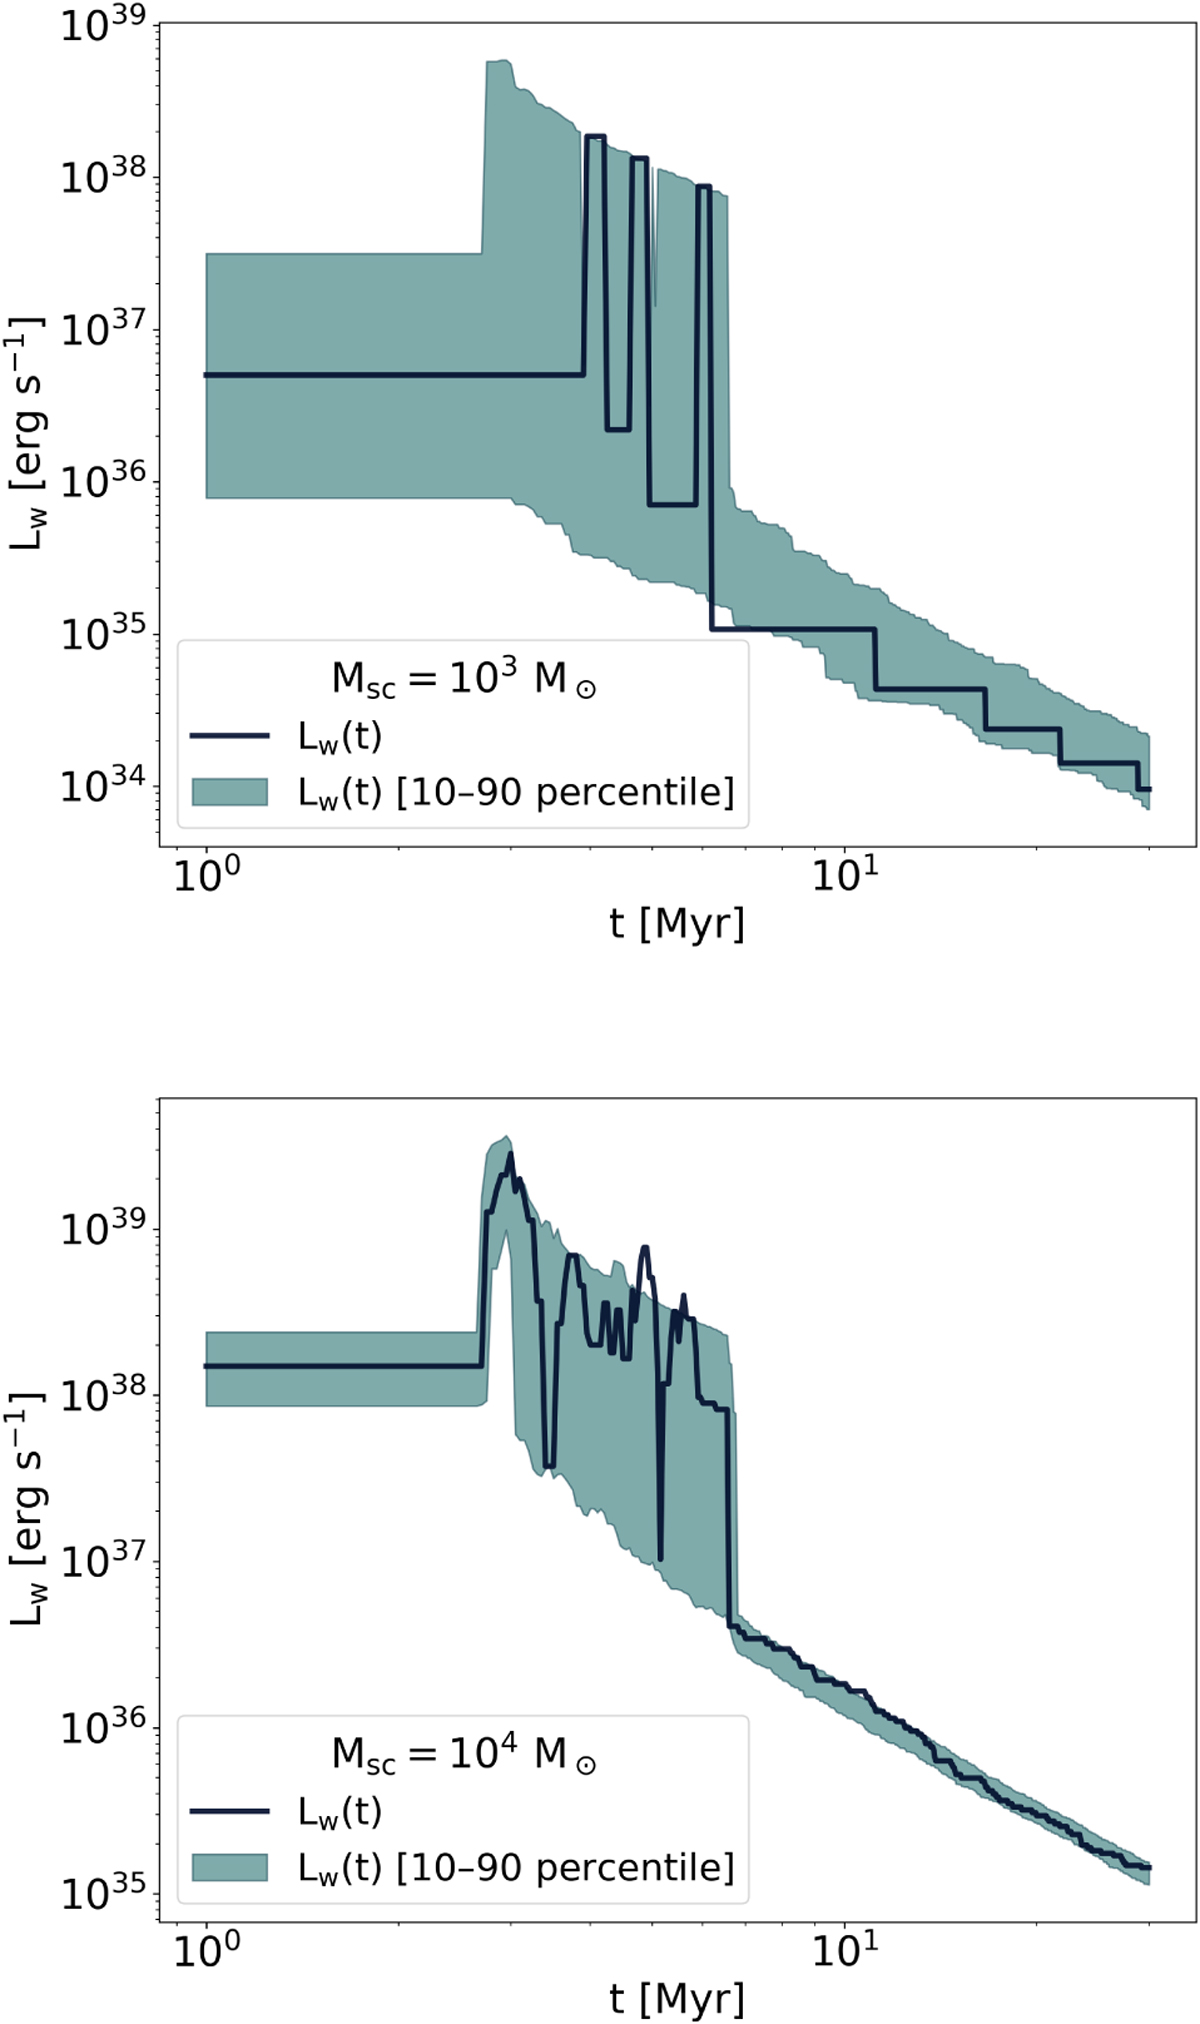
Wind power as a function of time for a YMSC with 103 M⊙ (upper plot) and 104 M⊙ (lower plot) is shown as a solid line. The shaded region shows how the wind luminosity can statistically vary for different random sampling of the initial stellar mass function. The limits of the shaded region are calculated as the 10% and 90% percentile out of 100 possible samplings of the initial stellar mass function.
Current usage metrics show cumulative count of Article Views (full-text article views including HTML views, PDF and ePub downloads, according to the available data) and Abstracts Views on Vision4Press platform.
Data correspond to usage on the plateform after 2015. The current usage metrics is available 48-96 hours after online publication and is updated daily on week days.
Initial download of the metrics may take a while.