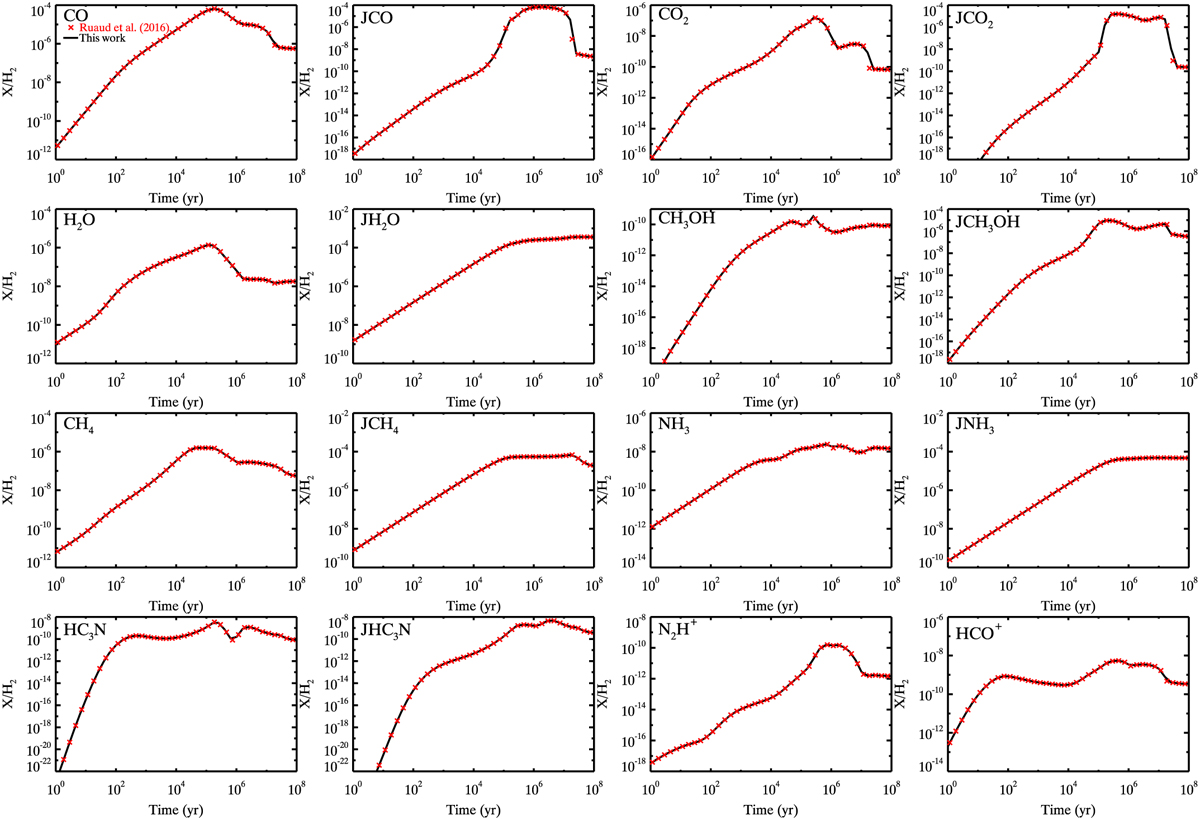
Fig. A.1
Download original image
Time-dependent evolution of the fractional abundances of several important species (CO, CO2, H2O, CH3 OH, CH4, NH3, HC3N, N2H+, and HCO+) with respect to H2 using the TMC1 model calculated by the Nautilus code. The letter J represents those species on the grains. The black solid lines are the results adopting the reaction network from Wang et al. (2021), and the red crosses represent the results adopting the reaction network from Ruaud et al. (2016), as an example network in the Nautilus package.
Current usage metrics show cumulative count of Article Views (full-text article views including HTML views, PDF and ePub downloads, according to the available data) and Abstracts Views on Vision4Press platform.
Data correspond to usage on the plateform after 2015. The current usage metrics is available 48-96 hours after online publication and is updated daily on week days.
Initial download of the metrics may take a while.