Fig. 8.
Download original image
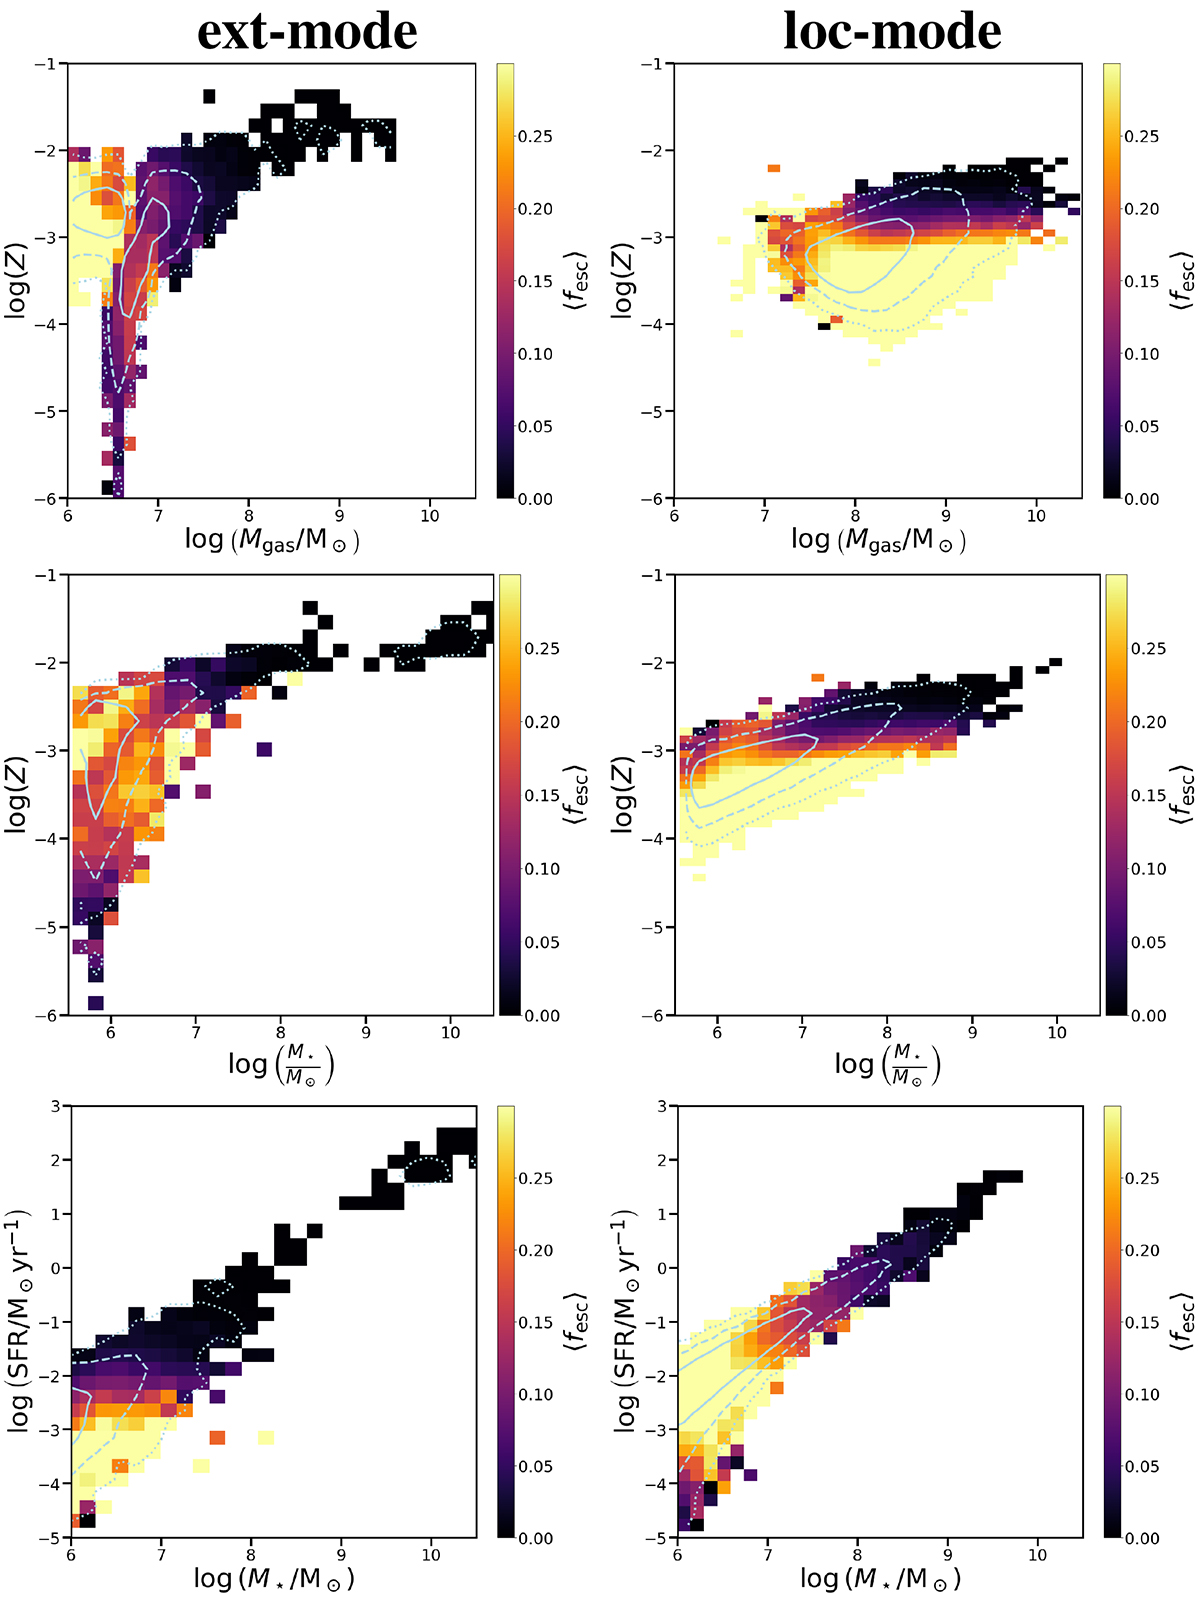
Average escape fraction as a function of metallicity and galactic gas mass (top panels), metallicity and galactic stellar mass (centre), and SFR and stellar mass (bottom). The left and right columns refer to galaxies with log(H/cm)< 20.8 and log(H/cm)> 21.3, which include the ext- and loc-modes, respectively. The contours denote the 1 (solid), 2 (dashed) and 3 (dotted) sigma distribution of galaxy counts.
Current usage metrics show cumulative count of Article Views (full-text article views including HTML views, PDF and ePub downloads, according to the available data) and Abstracts Views on Vision4Press platform.
Data correspond to usage on the plateform after 2015. The current usage metrics is available 48-96 hours after online publication and is updated daily on week days.
Initial download of the metrics may take a while.