Fig. 7.
Download original image
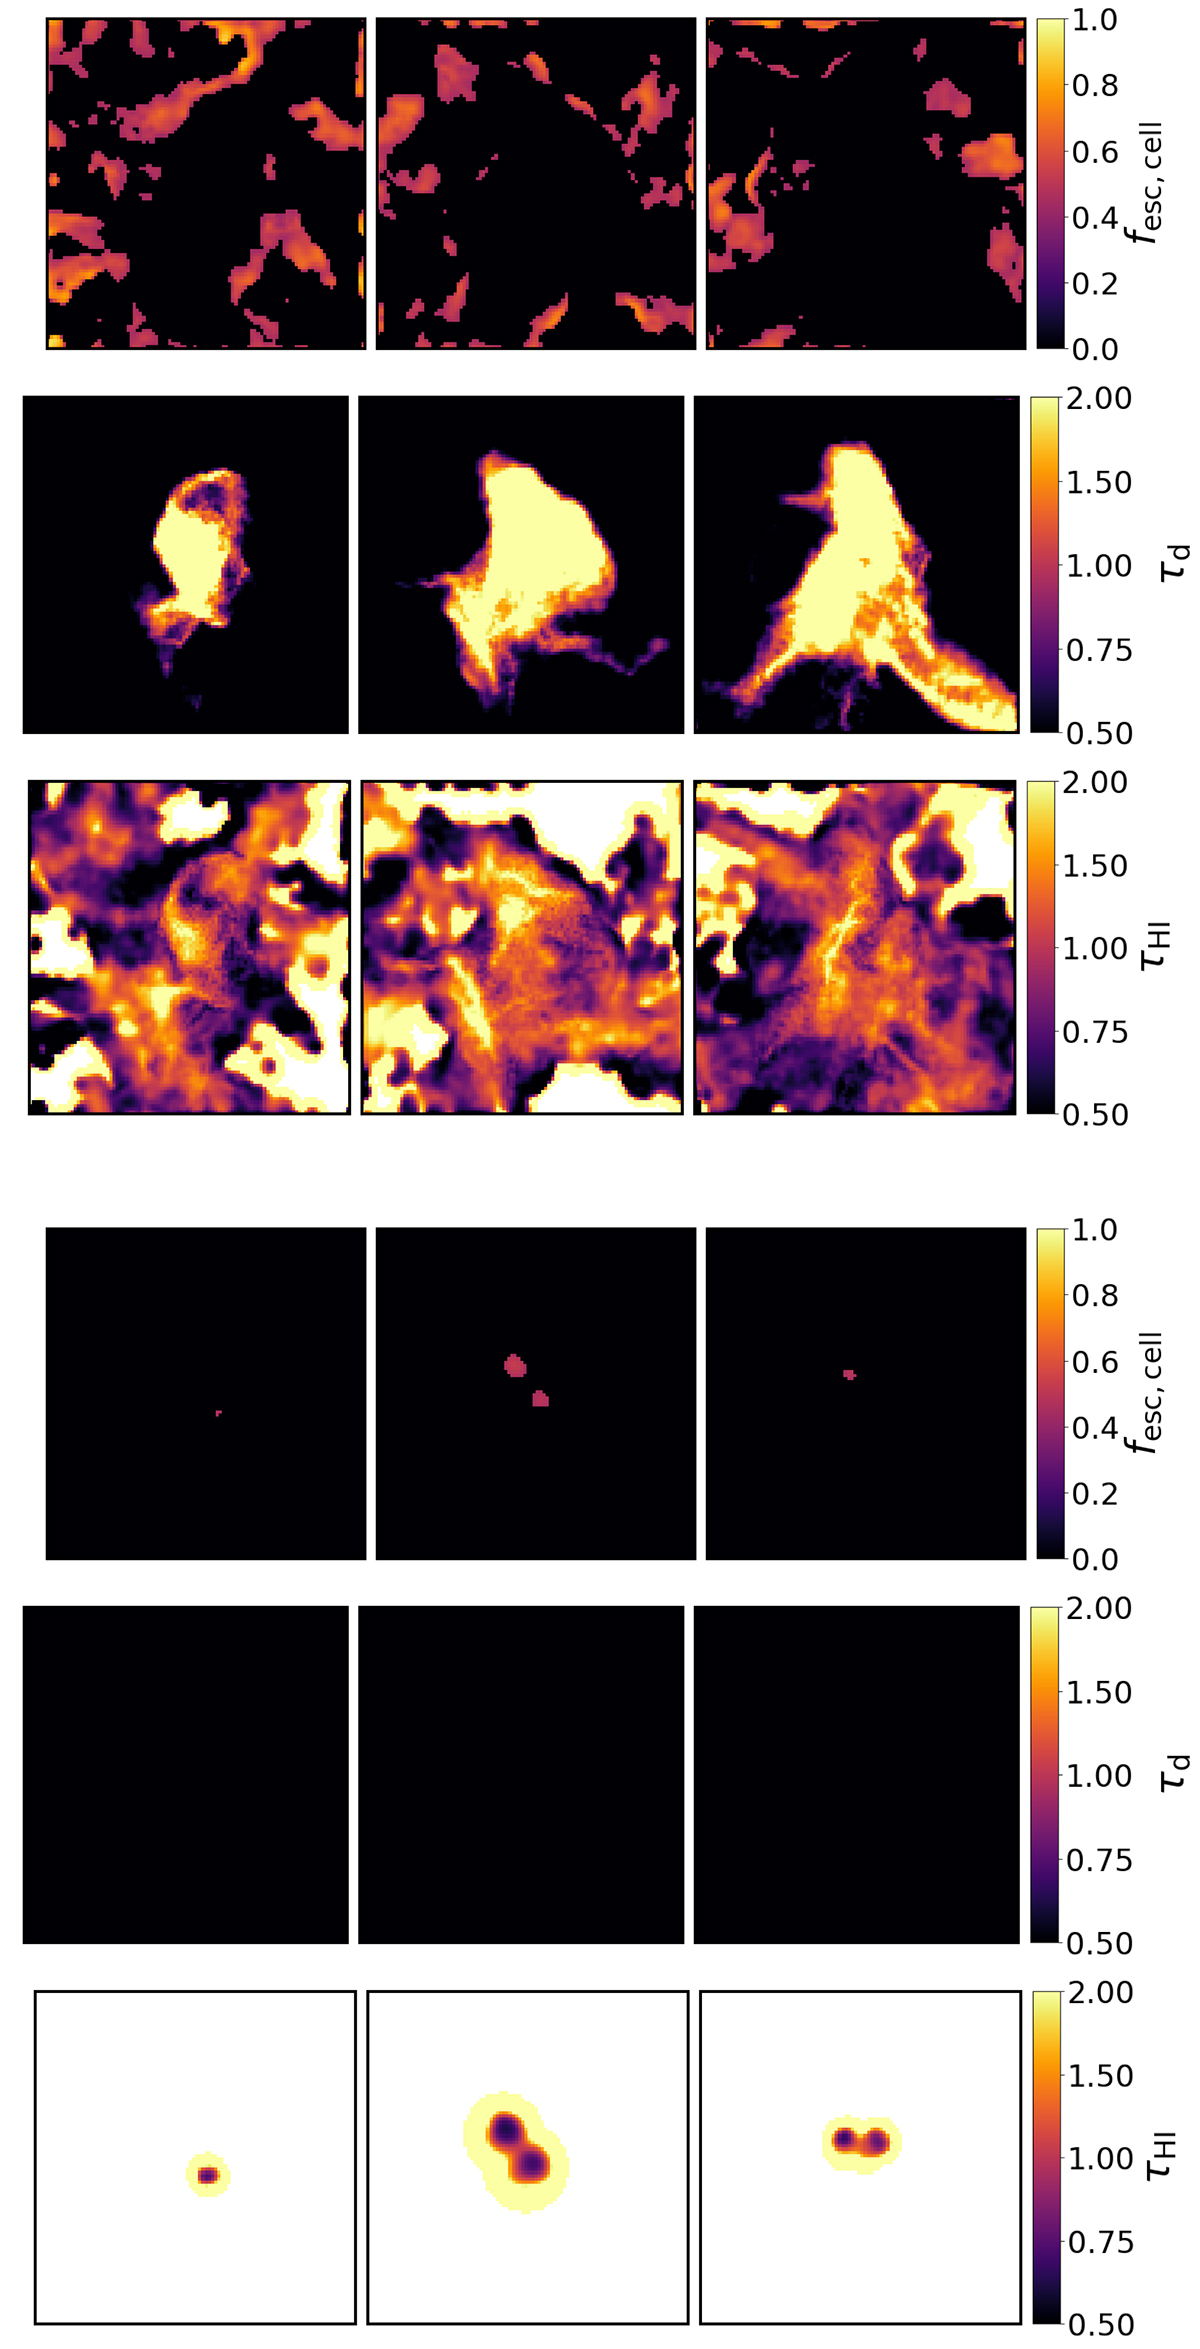
Galaxies with scale heights H > 1021.3 cm selected for their high and low SFR, that is log(SFR/M⊙ yr−1)=0.14, 0.20, and 0.40 (top) and log(SFR/M⊙ yr−1)= − 4.34, −4.05, and −4.08 (bottom figure). From top to bottom, the panels in each figure refer to the cell escape fraction, fesc, cell; optical depth of dust, τd; and of gas, τHI.
Current usage metrics show cumulative count of Article Views (full-text article views including HTML views, PDF and ePub downloads, according to the available data) and Abstracts Views on Vision4Press platform.
Data correspond to usage on the plateform after 2015. The current usage metrics is available 48-96 hours after online publication and is updated daily on week days.
Initial download of the metrics may take a while.