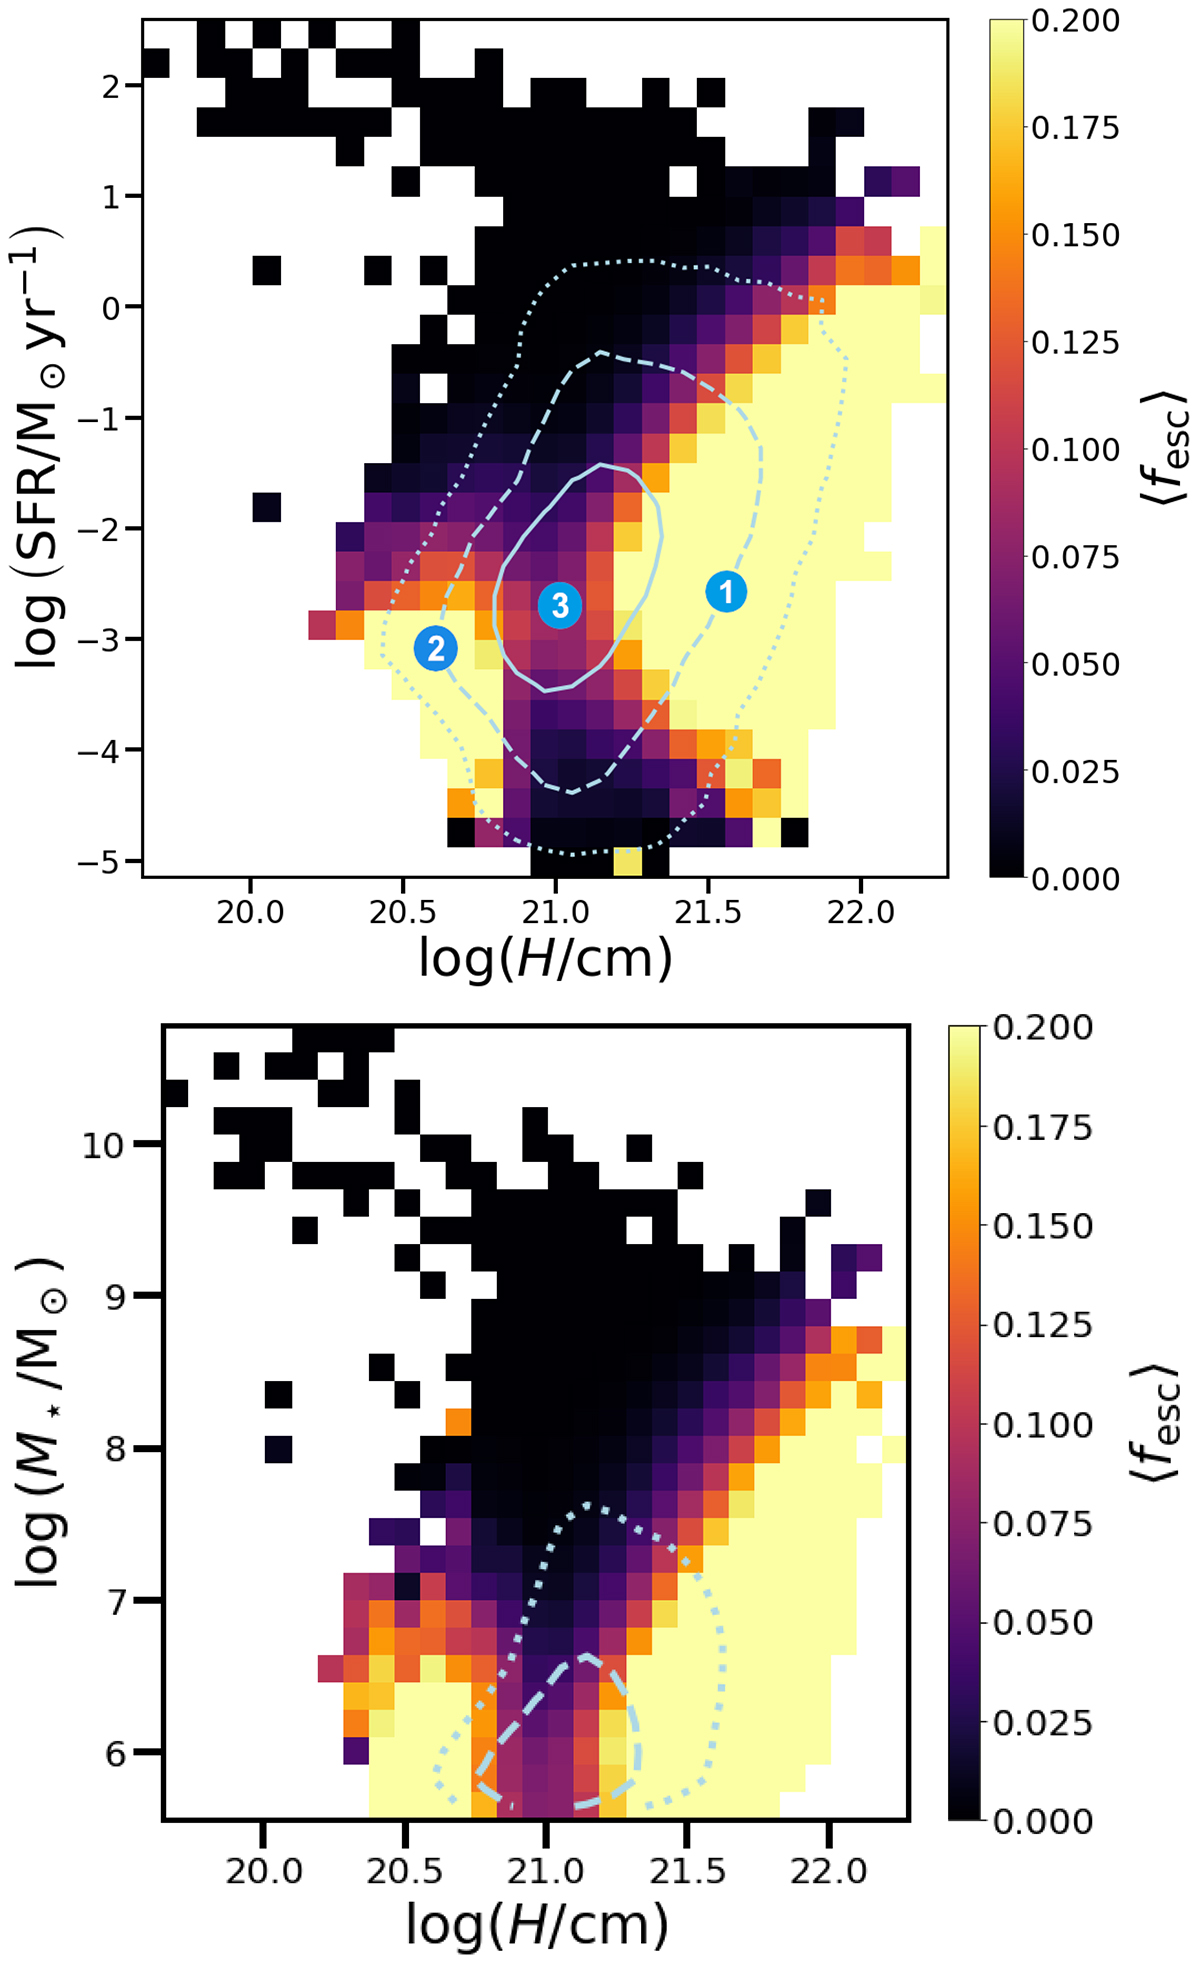
Fig. 4.
Download original image
Average escape fraction as a function of scale height and SFR (top) as well as a function of scale height and galactic stellar mass (bottom). The contours represent the distribution of galaxies as described in Fig. 2. The numbers label the areas that we identified as the localised escape mode (loc-mode, number 1), the extended escape mode (ext-mode, number 2) and the LyC dark mode (number 3).
Current usage metrics show cumulative count of Article Views (full-text article views including HTML views, PDF and ePub downloads, according to the available data) and Abstracts Views on Vision4Press platform.
Data correspond to usage on the plateform after 2015. The current usage metrics is available 48-96 hours after online publication and is updated daily on week days.
Initial download of the metrics may take a while.