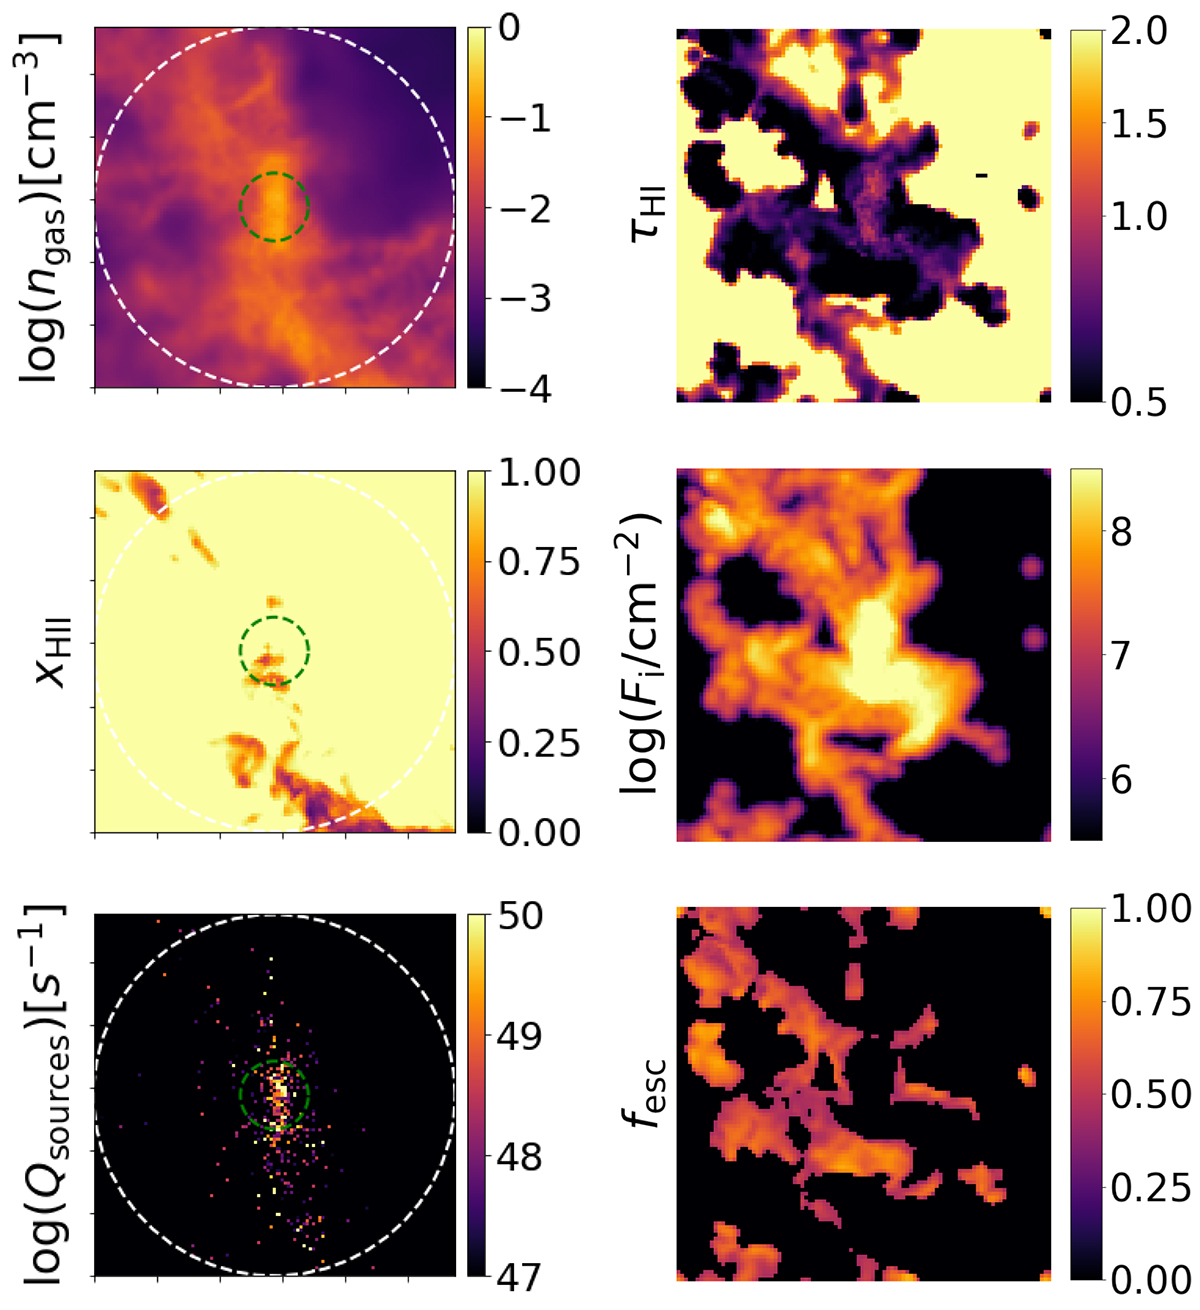
Fig. C.1.
Download original image
Comparison between a galaxy processed with CRASH-RT (left) and one processed with the semianalytic model (right). On the left we depict from top to bottom the average gas density (ngas), the average ionisation fraction (xHII) and the distribution and ionising emissivity of sources (Qsources). On the right we depict the hydrogen optical depth (τHI), ionising emissivity Fion and the location based escape fraction (fesc).
Current usage metrics show cumulative count of Article Views (full-text article views including HTML views, PDF and ePub downloads, according to the available data) and Abstracts Views on Vision4Press platform.
Data correspond to usage on the plateform after 2015. The current usage metrics is available 48-96 hours after online publication and is updated daily on week days.
Initial download of the metrics may take a while.