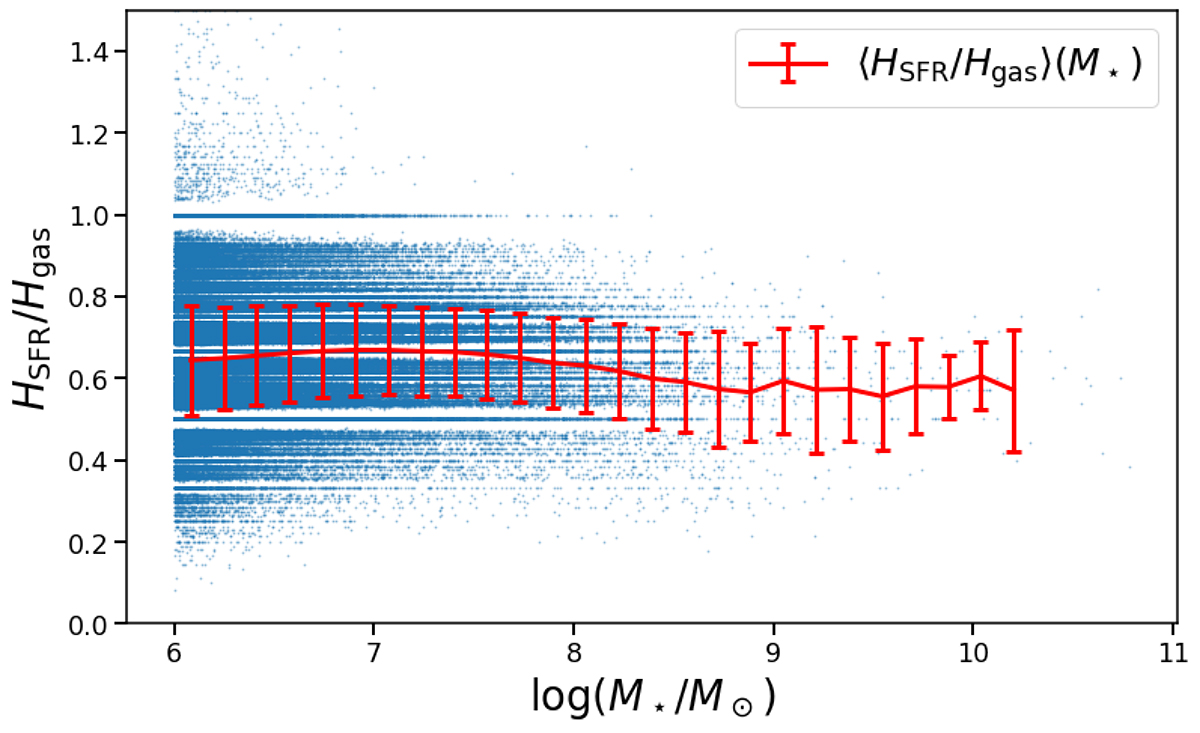
Fig. B.1.
Download original image
Ratio between the scale height of the star forming region and that of the gas as a function of galactic stellar mass. The red line represents the average value of this ratio, and the errorbars its one sigma scatter. The linear pattern in which the points appear is a consequence of measuring the scale height in discrete grid cell numbers.
Current usage metrics show cumulative count of Article Views (full-text article views including HTML views, PDF and ePub downloads, according to the available data) and Abstracts Views on Vision4Press platform.
Data correspond to usage on the plateform after 2015. The current usage metrics is available 48-96 hours after online publication and is updated daily on week days.
Initial download of the metrics may take a while.