Open Access
Fig. A.1.
Download original image
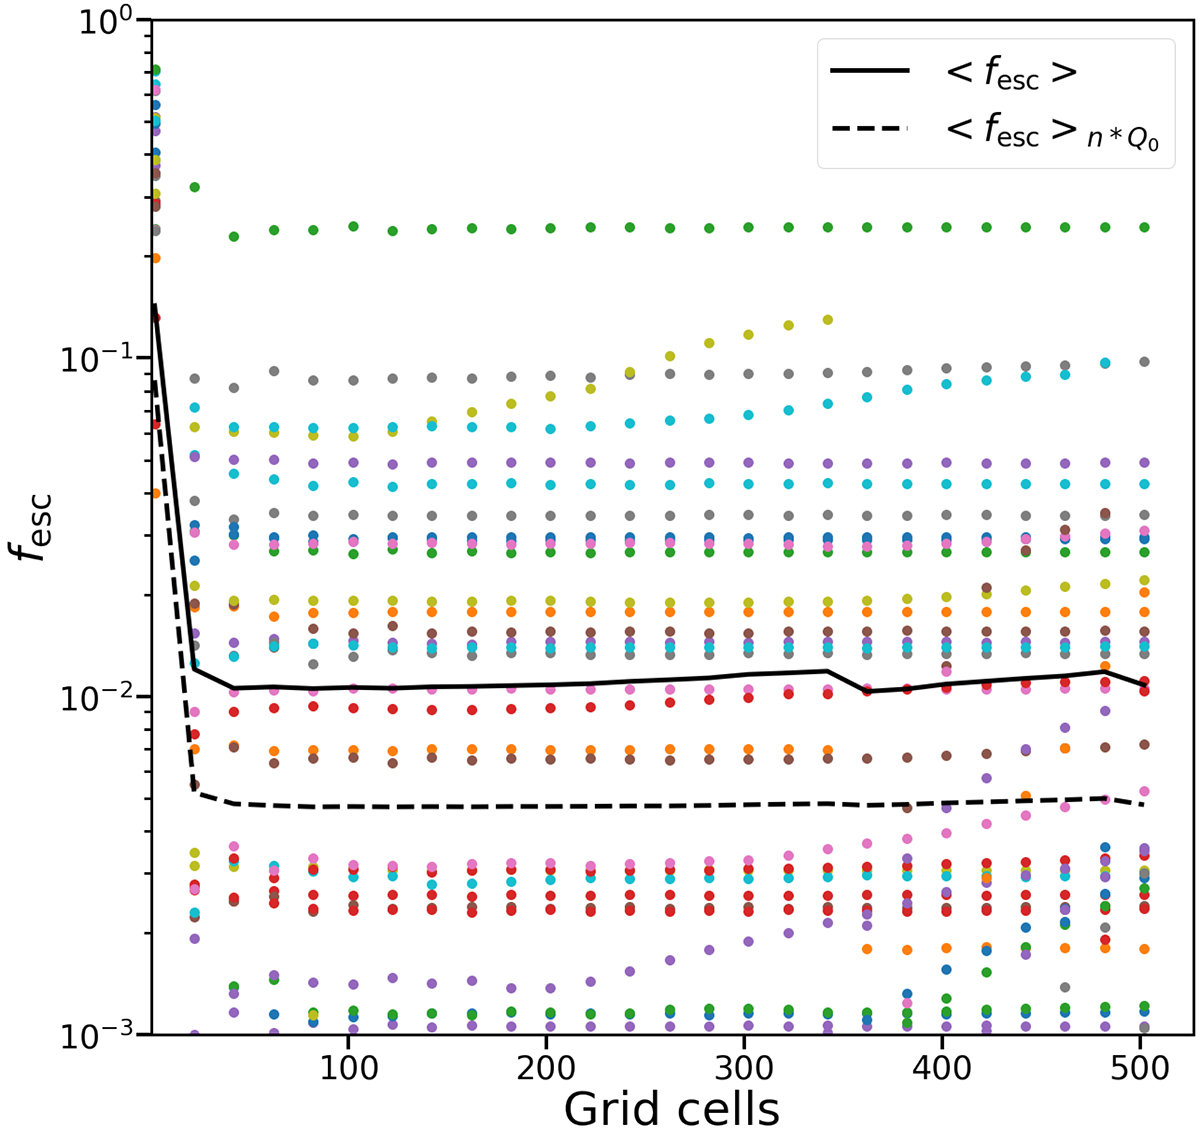
Escape fraction of a sample of galaxies as a function of the number of grid cells per dimension. We additionally depict the average escape fraction (black continuous line) and the average escape fraction weighted by the emissivity (black dashed line).
Current usage metrics show cumulative count of Article Views (full-text article views including HTML views, PDF and ePub downloads, according to the available data) and Abstracts Views on Vision4Press platform.
Data correspond to usage on the plateform after 2015. The current usage metrics is available 48-96 hours after online publication and is updated daily on week days.
Initial download of the metrics may take a while.