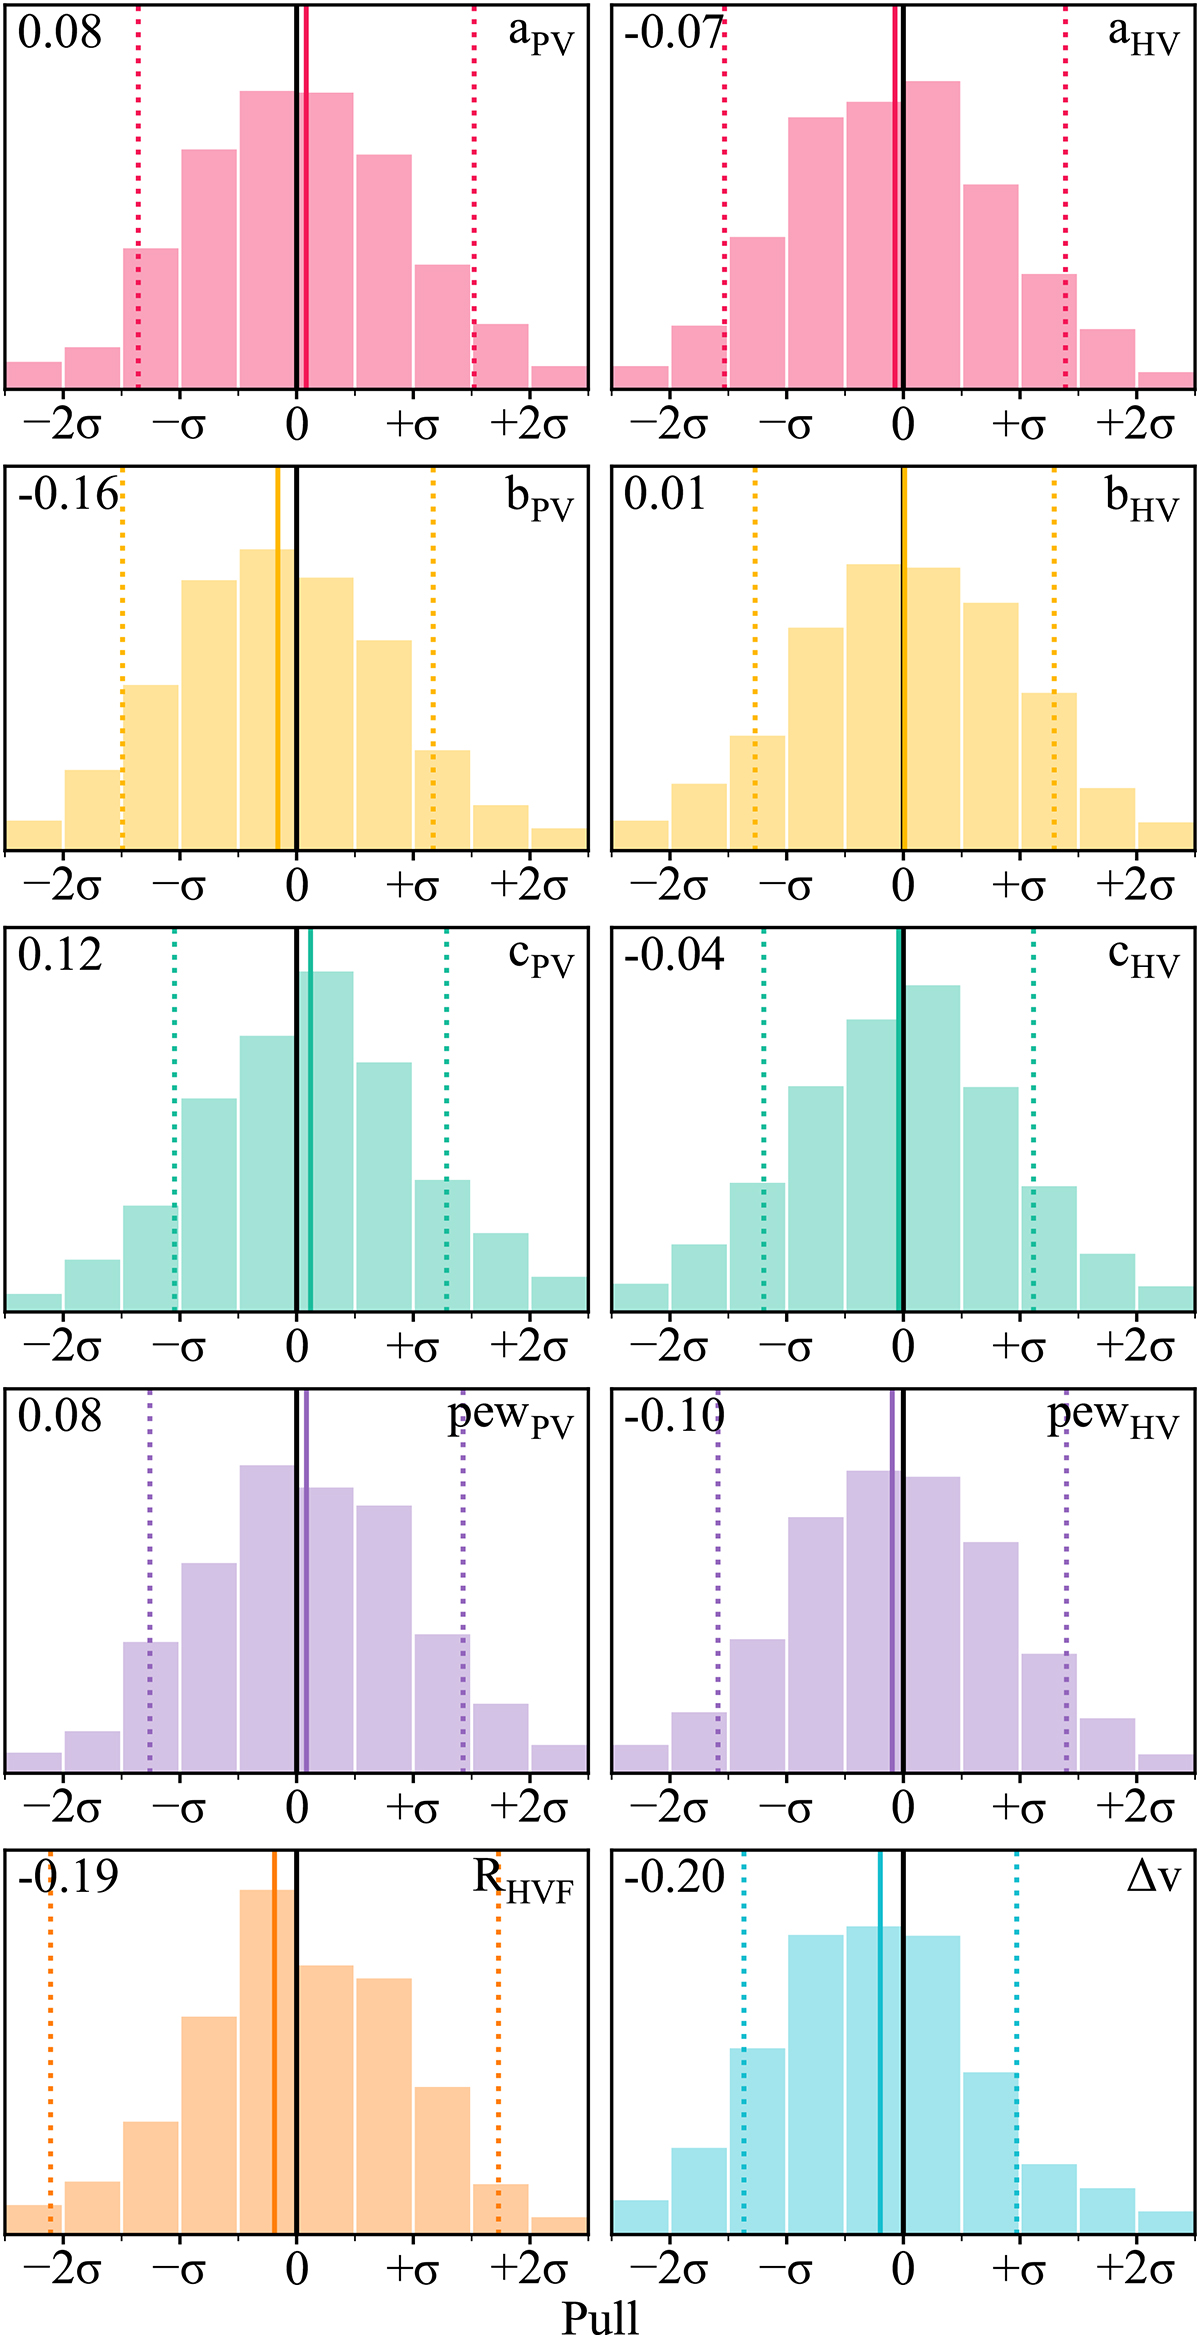
Fig. 4.
Download original image
Distribution of the pulls (residual/uncertainty) for the six feature parameters in the case of spectra with an S/N of 15, a dispersion of 5 Å/pix, and a velocity separation of 5000 km s−1. The solid black lines indicate the desired zero pull value, while the solid coloured lines indicate the means of the distributions, the values of which are shown in the top left corner of each panel. The dotted lines display the measured standard deviations.
Current usage metrics show cumulative count of Article Views (full-text article views including HTML views, PDF and ePub downloads, according to the available data) and Abstracts Views on Vision4Press platform.
Data correspond to usage on the plateform after 2015. The current usage metrics is available 48-96 hours after online publication and is updated daily on week days.
Initial download of the metrics may take a while.